Environmental Technologies Industries
 |
Environmental Technologies Industries
 |
| Climate Change Report |
Chapter 5 - Country Market Profiles
|
 |
|
|
Chapter 5 - Country Market Profiles
This chapter describes markets for climate change mitigation technologies and services in six developing
countries: Brazil and Mexico in Latin America; China, India, and the Philippines in Asia; and South Africa
on the African continent. These countries are major contributors to global greenhouse gas (GHG) emissions
and/or active participants in the ongoing international climate change negotiations.
The country market profiles highlight opportunities for U.S. firms in mitigation technologies and services
exports in key economic sectors. The discussion of the market opportunities covers both the “additional”
market created by climate change initiatives and the “baseline” market for GHG mitigation technologies and
services in general. The markets are assessed qualitatively, with opportunities illustrated by quantitative
estimates from the available literature. Each profile also discusses the country’s principal drivers in the market
for climate change mitigation technologies: climate change policies, energy policies and programs, and climate
change-targeted donor funding. The profile also contains information about the country’s business climate,
energy supply, and GHG emission sources.
Brazil
Business Climate
Economic and Social Indicators. In January 1999, Brazil, the largest economy in South America, was hit by a
financial crisis leading to a 40 percent devaluation of its national currency, the real. Despite the initial negative
expectations from investors, Brazil’s economy is rapidly recovering from the crisis. Inflation might reach 7–10
percent in 1999, compared with the target of 17 percent stipulated in an agreement with the International
Monetary Fund on the $41.5 billion rescue package signed during the crisis. Although the economy is
expected to decline by 2 percent in 1999, positive growth of 4 percent is projected for 2000.
In general, since 1994, the Brazilian Government has succeeded in implementing its “Real Plan” stabilization
program. The program has dramatically reduced chronically high inflation rates, thereby increasing the income
of poorer Brazilians. The gross domestic product (GDP) per capita was $4,950 in 1998, with an unemployment
rate of about 8 percent (U.S. Department of State, 1998a). Within the country, Southeastern Brazil is the main
area of economic growth, with the state of Sao Paulo accounting for about a third of the country’s total GDP.
Privatization. The Brazilian Government is emphasizing increased economic opportunities for the private
sector through privatization, deregulation, and the removal of impediments to competition. The government
is continuing to reform its credit policies and subsidy and fiscal incentive programs in an effort to decrease
the public sector’s role in the economy. Two constitutionally mandated federal monopolies, the petroleum
and telecommunications sectors, have been successfully opening up to the private sector. The Brazilian
Congress has passed several general implementing regulations to permit foreign investment in other sectors,
including power generation. There still are discriminatory policies that may hamper privatization. The federal,
state, and municipal governments, as well as related agencies and companies, follow a “buy national”
procurement policy for certain contracts. There is also resistance to privatization in civil society from
nongovernment organizations as a result of strong nationalism as well as large and powerful unions.
Trade and Investment Policy. Trade liberalization has produced significant changes in Brazil’s trade profile.
Imports are increasing in response to lower tariffs and generally freer markets, and are now composed of a
wide variety of industrial, agricultural, and consumer goods. Brazil has made substantial progress in reducing
traditional border barriers such as tariffs and import licensing. Tariff rates still remain high in certain areas. In
1997, the average tariff was 13.8 percent compared with 32 percent in 1990. Several trade regulations in Brazil
are currently being revised due to Brazil’s involvement in MERCOSUR, the Southern Cone Market. In 1997,
Brazil and its MERCOSUR partners (Argentina, Paraguay, and Uruguay) implemented an across the board
3 percent increase on all tariffs raising the ceiling from 20 to 23 percent. MERCOSUR’s common external tariff
was implemented in 1995 and ranges from zero to 23 percent with certain exceptions. Generally, import tariff
increases have been used as a measure for reducing import demand and trade deficits (U.S. Department of State,
1998a).
Brazil and the United States have extensive trade ties. Brazil was the United States’ 11th largest export market
in 1997. Since 1994, U.S. exports to Brazil have nearly doubled.
Brazil has begun lifting foreign investment restrictions to encourage the entry of foreign capital. In 1995, the
Brazilian Congress approved constitutional amendments to eliminate the distinction between foreign and
national capital. Foreign investors have been permitted to invest in the Brazilian stock market since 1991. As
a result, gross foreign portfolio investment increased significantly from $760 million in 1991 to $37.2 billion in
1997. Foreign direct investment annual inflows during the same period increased from $700 million to almost
$18 billion (U.S. Department of State, 1998a). Foreign investment still faces various constraints in certain
strategic industries. Administrative nontransparency, legal and administrative restrictions on remittances, and
arbitrary application of regulations and laws are some of the other barriers to foreign investment. These
restrictions are expected to be reduced with the full implementation of the applicable constitutional
amendments.
Political Situation. Since 1995, the administration of President Fernando Henrique Cardoso has made
stabilization and reform of the economy and modernization of the state its highest priorities. Brazil has
passed several constitutional amendments enabling the state reforms necessary to consolidate economic
stabilization and lay the groundwork for the country’s future growth and development. This administration’s
reform plans have been hampered by a slow moving Congress and a lack of consensus in the government.
Other issues that have affected the Cardoso administration include severe social problems, including high
crime rates, resulting from the highest income disparity in the world.
Overview of Energy Supply and GHG Sources
Energy Supply. Brazil’s domestic oil production has been increasing over the past three decades: its share in
the energy balance rose from 32 percent in 1970 to over 50 percent in 1994. The share of natural gas in the
primary energy supply is also growing rapidly due to its importation from Bolivia. Renewable energy
(hydroelectricity and biomass) account for about 48 percent of Brazil’s primary energy inputs. However, some
sources estimate that in 1996 hydroelectricity alone represented 44 percent of primary energy produced in the
country, making it the primary energy source in the country.
Fuel wood and sugarcane products (bagasse and alcohol) are the main biomass fuels produced in the country.
About 80 percent of the fuel wood comes from energy plantations, and the remainder from deforestation. Bagasse
is currently used mainly in the alcohol-sugar industry to generate process heat, mechanical power, and
electricity. After the use of alcohol as vehicle fuel peaked in the 1970s and 1980s, it has been on the decline
due to reduced government subsidies needed to keep alcohol fuel competitive with gasoline. Despite the
decline, Brazil currently has about 4.5 million ethanol-powered vehicles.
Table 4 - Brazil’s Primary Energy Supply by Source, 1994
Energy Source | Supply, million tons of oil equivalent | Share of total supply, % |
| Coal | 11.2 | 7.0 |
| Oil | 81.1 | 50.9 |
| Natural Gas | 4.0 | 2.5 |
| Hydropower | 20.9 | 13.1 |
| Biomass | 39.5 | 24.8 |
| Other | 2.7 | 1.7 |
| Total | 159.4 | 100.0 |
Source: International Energy Agency.
GHG Sources. In 1995, Brazil’s GHG emissions were the 16th largest in the world, the country’s energy-related
carbon emissions constituting 1.1 percent of the world’s total. The transport sector is the largest source of
carbon emissions in Brazil (responsible for 43 percent of the total emissions), followed by industrial production
(see figure 1).
Figure 1 - Sources of Brazil’s CO2 Emissions, 1996
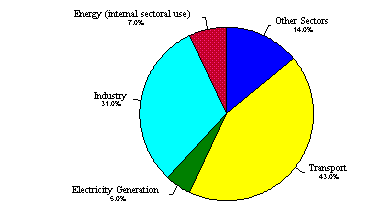 Total: 287.5 million tons
Source: Jannuzzi, 1998
Market Drivers
Climate Change Policies. Brazil ratified the UNFCCC in 1994 and signed the Kyoto Protocol in April 1998. In 1997, a presidential decree established a Sustainable Development and National Agenda XXI Policies Commission. The commission is chaired by a representative of the Ministry of Environment, Water Resources and Legal Amazonia, and includes representatives from four more ministries and several nongovernmental stakeholders. The commission is currently overseeing the preparation of Brazil’s first National Communication under the UNFCCC. The communication will contain an inventory of GHG
emissions, a general description of steps to be taken to control them, and other information on envisioned policy measures to mitigate climate change.
Brazil intends to adopt a “fast track” for the implementation of Clean Development Mechanism. The National Bank for Economic and Social Development (BNDES) and the Financing Agency for Studies and Projects (FINEP) are planning to set up a special fund to purchase and maintain a portfolio of emission reduction credits from projects carried out in the country.
Energy Policies and Programs. Brazil has made substantial progress during the 1990s in privatizing its
energy industry. The national power generation holding company (Electrobras) is being privatized, as are
most of the state distribution utilities. Currently, 47 percent of the distribution sector has been privatized,
and the power generation market has been opened to independent power producers. Although privatization
has many ramifications for the way energy is produced and consumed in Brazil, the greatest impact on GHG
emissions will be caused by the privatized entities’ efforts to bring energy prices more in line with costs.
In 1995, the government stated its intention to phase in full cost recovery pricing for utility rates. The
fuel subsidies have been almost completely phased out (from the 1991 subsidy rate of 26 percent).
The National Electricity Conservation Program (PRO-CEL) is the energy efficiency promotion group within
Electrobras. PROCEL’s 1995 budget included $6 million for core programs funded through grants and $21
million for low-interest loans from the capital investment fund for the power sector. When Electrobras is
privatized, it is expected that PROCEL will become an autonomously managed group. According to the
regulations established for the new structure of Brazil’s electricity industry, 1 percent of electricity revenues
will be set aside for PROCEL’s efficiency programs.
PROCEL has recently initiated a wide range of energy efficiency programs, including energy audits, appliance
labeling, and public lighting programs. Energy efficiency standards have been implemented for boilers,
refrigerators, small air conditioners, buildings, and electric motors. PROCEL actively supports the development
of Brazilian energy service companies (ESCOs) and is establishing a fund to assist ESCO projects.
CONPET (National Program for the Rational Use of Natural Gas and Petroleum Products) receives funding from
Petrobras, the national oil and gas company, and conducts programs in the transportation, residential,
commercial, agricultural, and power sectors. Targeting primarily oil and gas consumption, CONPET has been
promoting energy-efficient technologies and developed technical norms for energy production.
During the 1990s, Electrobras initiated a program designed to encourage electricity generation by small power
producers, notably small hydropower, wind, and biomass generators, and cogenerators. In addition, CEPEL
(the Center for Electric Energy Research) undertook several demonstration projects on renewable energy and
established a reference center for solar and wind energy. Import taxes on renewable energy equipment were
reduced during the 1990s, and in 1997 the 18 percent value-added tax was completely eliminated for certain
types of renewable energy equipment.
Targeted Donor Funding. Brazil is a major recipient of World Bank/Global Environment Facility (GEF) funds
for climate change mitigation projects, with the total portfolio (including local cofinancing) of almost $500
million. However, unlike many other developing countries, Brazil does not depend entirely on donor money in
its climate change initiatives. Climate change-related donor funding in Brazil generally complements significant
contributions of the Brazilian Government and private sector.
USAID’s climate change activities in Brazil focus primarily on forestry, with energy-related technical assistance
helping the Brazilians implement the larger World Bank/GEF projects.
Market Opportunities
Brazil represents a significant market for GHG-reducing technologies and services, particularly in the areas of
renewable energy, industrial cogeneration and process controls, building envelope and controls, and clean
fuel vehicles. The total energy efficiency market for all sectors in Brazil (which goes beyond climate change
initiatives) had an estimated value of $631 million in 1996.
Energy Supply Sector. Brazil’s power sector has been dominated historically by hydropower that generates no
GHG emissions. Still, thermal power plants play a major role in some regions of the country, particularly in the
Amazon region and the south, and their installed capacity will grow in the next decade. Therefore, there will be
opportunities for advanced natural gas combustion technologies (e.g., combined cycle) as natural gas will be
increasingly used in thermal power generation. As a result of natural gas imports from Bolivia, Petrobras
expects it to account for 10 percent of the primary energy supply by 2010.
One of the principal ways to reduce GHG emissions from power generation in Brazil is to further increase the
use of renewable energy. Agricultural and forestry wastes and residues (e.g., bagasse — sugarcane industry
waste) are used by many rural industries for on-site process heat and/or power production. For example, in
the state of Sao Paulo, the installed capacity of bagasse-based cogeneration is about 115 MW. As of
mid-1997, there were two reported bagasse-fueled cogeneration projects under development in this state with
a potential capacity of 375 MW.
The GEF is participating in financing a $100 million project to demonstrate the benefits of using the biomass
integrated gasification/gas turbine technology for electricity cogeneration on a commercial scale. The project
is carried out by a consortium of public and private companies (including Petrobras and Shell) and consists of
the construction, commissioning, and testing in the state of Bahia of a 32 MW demonstration plant running on
wood chip fuel from plantation forests. The implementation phase of the project is currently under way.
General Electric is a principal equipment supplier for the project.
Other sources of biomass also have market potential. For instance, the municipal government of Sao Paulo
has recently authorized methane recovery from the city’s landfills for the purpose of satisfying the landfills’
electricity needs.
As overall energy supply efficiency remains a high priority in Brazil, the $200 million World Bank/GEF Brazil
Energy Efficiency Project was launched in 1997 to support PROCEL’s programs. The project supports
supply-side loss reduction investments, promotes integrated supply and demand-side management (DSM)
projects, and creates mechanisms to finance energy efficiency investments by utilities, consumers, and
energy service companies.
Manufacturing Sector. Presently, various industries produce electricity using cogeneration to supply their
own needs and sell the excess power to the grid. For example, Petrobras has signed agreements to implement
combined cycle cogeneration projects at two refineries that would provide 570 MW capacity to the grid.
Significant opportunities for cogeneration also exist in the sugar and alcohol industry (Brazil is the largest
sugar producer in the world) as well as in the steel and aluminum production industry. Brazil’s cogeneration
market was estimated at $54 million in 1996.
According to some estimates (Hagler Bailly, 1997), there is also a big market for industrial process controls
($204 million a year) and a smaller market for energy-efficient motors and adjustable speed drives ($15 million).
However, these markets can only partly be regarded as climate change related. They are mostly driven by
the industries’ desire to improve their bottom line.
Commercial and Residential Sectors. In addition to the governmental DSM programs described earlier,
Brazil’s private sector is also conducting energy efficiency initiatives. For example, the organization of the
Brazilian lighting industry (ABILUX) has developed a pipeline of lighting efficiency projects valued at
$20–30 million. There is also market demand for building envelope and building controls technologies.
Transportation Sector. As mentioned earlier, the transportation sector is the largest source of GHG emissions
in Brazil. To address this problem, CONPET in 1997 introduced the “Economizar” project which targets cargo
and passenger transportation companies that maintain their own garages. Trained technicians visit these
companies to assess fuel consumption, audit fuel use management methods, and check exhaust emissions. In
addition, a presidential decree created an energy efficiency label to be used to identify the light vehicle with
the best performance rating in each of several categories.
Local governments are also implementing programs to reduce energy use in the transportation sector. For
example, in Sao Paulo, diesel-powered vehicles in the municipal fleet are being replaced by natural gas vehicles.
The fuel switching program was launched in 1996 and is expected to take 10 years. It will cover 11,000
municipal vehicles.
In 1994, Brazil’s National Department of Water and Electrical Energy launched an “Environmental Strategy for
Energy: Hydrogen Fuel Cell Buses for Brazil” project with financial support from the GEF. The second phase
of this project is expected to start in 2000 and will include procurement of at least nine fuel cell-powered buses
to be used in the state of Sao Paulo for public transportation. Its total implementation cost will be between
$45 million and $55 million. Potentially, similar projects may be undertaken in the states of Minas Gerais,
Rio de Janeiro, Paran, and Bahia. Ballard (Canada) and Daimler–Chrysler (Germany/United States) are bidding
for the project’s procurement component.
For the past 20 years, the Brazilian Government has been subsidizing the use of alcohol (ethanol) from sugarcane
as vehicle fuel. The program included a commitment from Petrobras to buy a specified amount of ethanol,
incentives for companies producing ethanol, and price subsidies for consumers. Currently, ethanol supplies
over 20 percent of the fuel demand for cars and light-duty vehicles in the country, generating significant
GHG-reduction benefits. However, the future of this program is uncertain: imminent privatization of Petrobras
may result in elimination of subsidies for ethanol fuel.
Best Prospects: Brazil
Energy Supply Sector: Advanced gas combustion technologies and biomass technologies.
Manufacturing Sector: Cogeneration, industrial process controls, and energy-efficient motors
Commercial and Residential Sectors: Lighting, building envelope, and building controls.
Transportation Sector: Clean-fuel vehicles (alcohol and compressed natural gas (CNG)). |
Mexico
Business Climate
Economic and Social Indicators. The Mexican Government has recently introduced a series of economic,
political, and institutional reforms designed to keep the economy on a path of steady growth. Macroeconomic
stabilization and floating exchange rate regimes have cut inflation to a third of its 1995 highs, and interest rates
have also moderated substantially. Inflation for 1999 is projected to be at about 10.9 percent, and the gross
domestic product (GDP) growth rate is expected to be at about 3.7 percent. Unemployment is also low — just
3.5 percent. GDP per capita surpassed $4,000 in 1998 and continues to grow. These are clear signs that the
Mexican Government has moved beyond the economic recovery from the 1995 recession and the devaluation
of the peso, and is now focused on sustained economic growth. All major sectors are experiencing some
growth, with transportation, construction, manufacturing, commerce, and services registering increases over
20 percent.
In June 1997, the Mexican Government released its economic policy framework and projections through the
year 2000 as part of the National Program for Development Finance (PRONAFIDE). PRONAFIDE envisions
an average annual GDP growth of 5 percent and the creation of one million formal sector jobs per year,
supported by growing domestic savings, a high level of foreign direct investment, and responsible monetary
and fiscal policy. The program was well received both domestically and internationally.
Privatization. The Mexican Government continues to pursue a policy of privatization and deregulation of
the economy. Since the 1980s, it has sold some 1,155 state-owned enterprises — at the end of 1996, only
116 parastatals were in the hands of the government (U.S. Department of State, 1998b).
Mexico’s energy policy acknowledges the need to attract private capital into the energy sector. Previous
government measures lifted prohibitions on investment in some aspects of power generation and natural gas
transmission and distribution. They created limited opportunities for foreign participation in various areas,
including cogeneration and independent power generation projects. The role of private investment could
increase dramatically if President Ernesto Zedillo’s administration succeeds in carrying out its recently
announced plan for a sweeping legislative and constitutional reform of the electricity sector.
Trade and Investment Policy. Mexico’s trade policy toward the United States has been influenced by the
requirements of the North American Free Trade Agreement (NAFTA) enacted in 1994. It continues to be a
key factor in boosting Mexico’s imports and raising its overall level of economic activity, as well as spurring
competitiveness and institutional reform. To comply with NAFTA requirements, Mexico has further lowered
its tariffs on goods originating in the United States and Canada. Mexican tariffs on U.S. goods are now
between zero and 10 percent of value. Eighty-five percent of U.S. goods now enter Mexico duty free.
Additionally, Mexico has abolished its import licensing requirements for most U.S.-origin goods. Mexico
continues negotiations for NAFTA-consistent free trade agreements with every other South and Central
American country, including the MERCOSUR group, as well as with Israel and the European Union.
In 1998, Mexico was rated one of the three safest emerging markets for international investors. In December
1993, the government passed a foreign investment law that replaced a restrictive 1973 statute. The new
foreign investment law has opened more areas of the economy to foreign ownership. It has also provided
national treatment for most foreign investment, eliminated all performance requirements for foreign investment
projects, and liberalized criteria for automatic approval of foreign investment proposals. Foreign direct
investment in Mexico has been on the increase, totaling $7,981 million in 1997.
Political Situation. Mexico continues to enjoy relative political stability with the Institutional Revolutionary
Party (PRI) winning every presidential election since 1929. President Zedillo has been in office since the
general elections of 1994. His main challenges have been managing the economic recovery from the 1995
recession and local insurgencies by guerrilla forces in the state of Chiapas. The Zedillo administration has
also been focusing on socioeconomic problems of poverty and income distribution disparities. Political
reforms by the administration have opened the political space and in 1998 resulted in an alternation of power
among the traditional governing party and the two major opposition parties in the lower house of congress
and in state governorships. This has injected new transparency and accountability into the political mix,
positively affecting the economy.
Overview of Energy Supply and GHG Sources
Energy Supply. Mexico is the world’s fifth largest producer of crude oil and possesses the second largest oil
reserves in the Western Hemisphere. It is also the world’s eighth largest producer of natural gas. Oil and
natural gas combined comprise almost 85 percent of the country’s total primary energy supply (table 5).
Demand for natural gas in Mexico is expected to grow by 9–11 percent per year over the next eight years.
This growth is spurred by the Mexican Government’s attempts to reduce pollution by substituting gas for
coal and oil in the energy balance, as well as the rising energy demand (energy use in Mexico has recently
been increasing by 7 percent a year).
Renewable energy constitutes almost 10 percent of the primary energy supply. Mexico ranks third in the
world in geothermal power generation with over 750 MW of installed capacity, over 80 percent of which is
found in Baja California. Mexico also has substantial biomass resources in the south of the country, although
biomass is mostly used for noncommercial energy applications.
Table 5 - Mexico’s Primary Energy Supply by Source, 1995
Energy Source | Supply, million tons of oil equivalent | Share of total supply, % |
| Coal | 5.4 | 4.1 |
| Oil | 84.8 | 63.5 |
| Natural Gas | 25.9 | 19.4 |
| Nuclear Power | 2.2 | 1.6 |
| Hydropower | 2.4 | 1.8 |
| Biomass | 7.9 | 5.9 |
| Other Renewables | 4.9 | 3.7 |
| Total | 133.5 | 100.0 |
Source: International Energy Agency, 1997a.
GHG Sources. Mexico was the world’s 13th largest emitter of energy-related carbon dioxide in 1993. Among
developing countries, only China and India had higher emissions. The high growth in CO2 emissions (about
5 percent a year) is primarily due to the growing oil and natural gas use, in particular in industrial processes
and power generation. Oil was the source of 77 percent of energy-related CO2 emissions in 1993 (IEA, 1996).
Among the various end-use sectors, transport and industry (including oil refining) are the main contributors
to CO2 emissions (see figure 2).
Figure 2 - Sources of Mexico’s CO2 Emissions, 1993
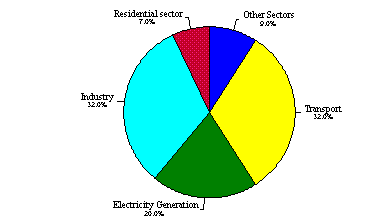 Total: 323.4 million tons
 Source: International Energy Agency, 1996.
Market Drivers
Climate Change Policies. Mexico ratified the UNFCCC in March 1993 and signed the Kyoto Protocol in June
1998. Although Mexico joined the Organization for Economic Cooperation and Development (OECD) in 1994,
it is not bound by the same obligations under the UNFCCC as other OECD countries, since it is not listed in
annex I of the convention. Mexico has not set a goal of stabilizing or reducing its CO2 emissions but has
embarked on a range of policy actions on climate change mitigation. In April 1997, Mexico established an
Inter-Secretarial Committee on Climate Change (ISCCC). The committee includes representatives of the
following Secretariats (ministries): Energy; Environment, Natural Resources and Fisheries; Commerce and
Industrial Development; Communications and Transport; and several other agencies. The committee
submitted Mexico’s first National Communication to the UNFCCC in December 1997, prepared the “Mexico
and Climate Change” study for the Buenos Aires round of international climate change negotiations in 1998,
and released the “Program for National Action on Climate Change” for public comments in March 1999. The
national action program includes the following sectoral components:
Energy programs, including promotion of natural gas use, energy efficiency and energy conservation,
and promotion of renewable energy sources;
Natural resources programs, including sound forest management practices;
Industry sector programs, including promotion of fuel substitution and fuel efficiency measures and
adoption of cleaner production practices;
Urban development programs, including land use regulation and urban environmental management; and
Transportation programs, including improved traffic management and vehicle emissions regulations.
Specific climate change mitigation projects are being developed by the Mitigation Office that has been
established within Mexico’s National Institute of Ecology. The Mitigation Office also plans to act as a
promoter and intermediary for potential CDM projects in Mexico.
The CDM is consistent with Mexico’s national climate change action program and is seen by the government
as an excellent opportunity to attract resources for clean development in the country. Mexico is taking an
active part in the ongoing international negotiations on CDM rules and procedures.
Energy Policies and Programs. Mexico’s Secretariat of Energy coordinates and supervises the National
Commission for Energy Conservation (CONAE) and is responsible for energy development in general, as well
as for energy conservation policies. CONAE was created in 1989 and is composed of representatives of seven
federal ministries, the Federal Electric Commission (CFE), the petroleum monopoly PEMEX, and Mexico City’s
Executive Board.
CONAE is supporting the adoption of energy-efficient technologies and has initiated a number of programs to
promote energy conservation in various sectors. It has developed 18 energy efficiency standards for industrial
boilers, household boilers, electric motors, refrigerators, air conditioners, and buildings. CONAE also supervises
the Electric Sector Program for Energy Savings initiated by CFE, which includes, among others:
Energy audits in the industrial sector,
Restructuring of industrial electricity tariffs, and
A project promoting the use of compact fluorescent lamps in the residential sector to reduce electricity
consumption for lighting.
The energy savings program is supported by FIDE (Trust for Energy Efficiency Program in the Power Sector),
a private sector trust fund created specifically for this purpose. FIDE is a dynamic, implementation-oriented
agency that has had significant successes in all energy-consuming sectors. Having initially started by
conducting energy audits, FIDE is now concentrating on developing energy efficiency markets and working
on trade relationships with various energy-efficient product and technology manufacturers and vendors.
There are also several energy service companies active in Mexico.
The Mexican Government is actively promoting the larger share of natural gas in the country’s fuel market.
The Energy Regulatory Commission is currently auctioning and awarding gas distribution permits for many
areas of the country, including several cities along the Mexico–U.S. border.
Several environmental standards recently promulgated by SEMARNAP also contribute to fuel switching and
energy conservation in the power sector and industry. They aim at reducing emissions, optimizing combustion
processes, and reducing fuel consumption. The most important of these is NOM-85, which sets very stringent
emission standards for principal air pollutants, thereby driving fuel switching from coal and oil to natural gas.
Currently, Mexico’s energy markets are heavily regulated, with tariffs determined by a complex of economic,
financial, and social considerations. However, the new Energy Regulatory Commission is planning to phase
out most subsidies related to electricity production over the long term.
Recent changes in energy sector policies have allowed independent power producers to enter the Mexican
market for the first time. The most likely projects to be first affected by these changes are natural gas-fired
plants. In addition, the “Policy Proposal for Structural Reform of the Mexican Electricity Industry” released
in February 1999 is expected to lead to the divestiture of the CFE assets of through distribution and
transmission agreements and, possibly, even privatization of the power generation facilities.
Targeted Donor Funding. Both the World Bank and the Inter-American Development Bank (IDB) are cofunding
large projects in Mexico that are likely to lead to significant GHG reductions. However, these projects do not
have climate change mitigation as their primary objective and, therefore, do not represent an additional market.
On the other hand, joint implementation projects like Ilumex ($23 million, 1995–2006) can be regarded as a
prototype for future CDM initiatives in Mexico and as such are an important climate change market driver.
USAID is committing substantial resources to support activities in Mexico that reduce GHG emissions from
energy consumption and deforestation. In FY 1999, USAID allocated almost $5.6 million in technical assistance
for such activities. Key initiatives in the energy sector include energy efficiency audits in the industry sector
and energy efficiency promotion projects. This bilateral assistance enhances the market for U.S. firms interested
in pursuing climate change-related opportunities in Mexico.
Market Opportunities
Mexico is a particularly attractive climate change market for U.S. firms. The favorable business climate stemming
from well-established economic ties between the United States and Mexico, the leadership of the Mexican
Government on climate change issues, and the substantial U.S. bilateral aid for climate change mitigation
activities all contribute to the wide range of opportunities in this market across all economic sectors. While
the baseline market is very large (the total energy efficiency market is estimated at $471 million a year, the
additional market is just starting to emerge as the Mexican Government begins to implement the national
climate change action program. At the same time, this additional climate change market is expected to grow
rapidly due to Mexico’s willingness and preparedness to participate in the Clean Development Mechanism.
Energy Supply Sector. Mexico’s energy supply sector presents major market opportunities for power plant
conversion from oil to natural gas, as this is one of the stated priorities of the country’s Energy Secretariat.
In environmentally critical areas (e.g., in the vicinity of large cities), about 70 percent of the power plants
using fuel oil are expected to convert to natural gas before 2005. This large-scale conversion process creates
a significant market for advanced gas combustion technologies such as combined cycle and fuel cells.
There are also lucrative opportunities with respect to renewable energy technologies. Mexico is planning to
increase its geothermal power capacity by about one-third in the near future (Hagler Bailly, 1999). Mexico is
also making one of the largest investments in Latin America to provide electricity to schools, clinics, and
individual homes in rural areas through the use of photovoltaic systems, creating a substantial market for this
technology. Mexico will also be the testing ground for a World Bank $500,000 feasibility project aimed at
mitigating greenhouse gases by capturing methane released by solid waste landfills, and reusing it to generate
energy (BNA, 1999a — see Bibliography). Other renewable energy-related opportunities include the planned
expansion of the wind generating capacity in the state of Oaxaca.
Manufacturing Sector. The IDB-sponsored Energy Efficiency Program (1997–2002) aims at commercializing
energy-efficient equipment in the industrial and commercial sectors. The IDB’s $23.4 million loan provides
half of the resources for this project. The remaining 50 percent is provided by domestic FIDE and CFE grants.
In the manufacturing sector, the program includes incentives to purchase 155,000 energy-efficient electric
motors and 6,000 efficient compressors. The annual sales of electric motors in Mexico is about 200,000 units.
However, high-efficiency motors comprise only 3 percent of the total. This means that there is a significant
“baseline” market to be tapped, estimated at $49 million annually (Hagler Bailly, 1997).
Cogeneration is another promising market segment in Mexico. The annual size of the cogeneration market is
estimated at $62 million (Hagler Bailly, 1997). The best opportunities for industrial cogeneration exist in the
petrochemical, fertilizer, basic chemical, and pulp and paper industries.
Commercial and Residential Sectors. CFE’s residential program seeks to achieve energy savings by replacing
conventional lighting systems with compact fluorescent lamps (CFLs). CFLs are currently available from CFE
at competitive prices, and users pay for them on a four-month installment plan together with their monthly
power bills. This program is supported by Ilumex, a $23 million joint implementation project (1995–2006)
cofunded by the World Bank ($10 million), GEF ($10 million), and the Government of Norway ($3 million).
The project concentrates on the cities of Monterrey and Guadalajara. It is expected that by the end of the
project, 1.7 million conventional lamps will have been replaced by CFLs. In the first successful international
verification of GHG emission reductions, a Norwegian auditing firm certified in July 1999 that CFE has cut
GHG emissions by 171,000 tons over three years (BNA, 1999b).
Lighting is also one of the key components of the IDB-supported Energy Efficiency Program: the program is
expected to finance the purchase of about 1.25 million units of commercial lighting (FIDE, 1998). In 1996, the
overall lighting market in Mexico was estimated at $10 million per year (Hagler Bailly, 1997).
The new energy efficiency standards for buildings and appliances have created good opportunities for related
technologies and products. Although the available 1996 market size estimates are fairly high (e.g., $71 million a
year for building envelope technologies, $55 million for heating, ventilation, and air conditioning equipment,
and $43 million for other appliances) (Hagler Bailly, 1997), the additional climate change-related market is likely
to be much smaller.
Mexico’s 100 Public and Private Buildings Programs represent a major opportunity for consulting services in
the commercial sector. These programs are managed by CONAE and are modeled in part after the U.S. Energy
Star and Green Lights Partnership. As of August 1998, the 100 Public Buildings Program had completed energy
efficiency audits in 47 buildings. The 100 Private Buildings Program was expected to be launched in 1999 and
focus on hotels in Cancun, Mexico’s popular tourism destination.
Transportation Sector. As mentioned earlier, transportation is a major emitter of energy-related carbon
dioxide in Mexico. The transportation sector is one of the main targets of PROAIRE, Mexico’s Air Quality
Program (1996-2000). PROAIRE focuses on Mexico City, where vehicles are responsible for over 70 percent
of the total air emissions (UNAM, 1997). The program’s measures to control transport-related emissions
include, among others:
Changing emission standards for gasoline-fueled vehicles;
Replacing the fleet of high-use vehicles such as taxis and micro buses with new vehicles meeting emission
standards;
Converting gasoline-fueled cargo trucks to natural gas; and
Improving traffic and parking management systems.
The World Bank and GEF will support the second stage of the program, PROAIRE II (2000-2005), through the
Mexico Air Quality II project. Its total cost is $130 million, including $70 million from the World Bank and $20
million from GEF. The project will further support the introduction of cleaner fuels and fuel-efficient vehicles
in Mexico City’s metropolitan area. Specific investments are anticipated in procuring cleaner diesel or natural
gas-fueled buses and pilot testing of promising, cost-effective new vehicle technologies. There are also
attractive opportunities in transportation management consulting associated with this project.
Best Prospects: Mexico
Energy Supply Sector: Fuel switching (from oil and coal to natural gas), advanced natural gas combustion technologies (combined cycle and fuel cells), renewable energy technologies (geothermal, solar, and wind).
Manufacturing Sector: Efficient industrial motors, cogeneration.
Commercial and Residential Sectors: Energy-efficient lighting, building envelope, and appliances; energy efficiency consulting services.
Transportation Sector: Natural gas-fueled buses, and transportation management consulting services. |
China
Business Climate
Economic and Social Indicators. Over the past two decades, the People’s Republic of China has seen
tremendous growth as a result of its economic liberalization policies. However, the GDP growth rate has
dropped from double digits a few years ago to just below 7 percent in 1998. Both domestic economic factors
and the Asian economic crisis contributed to the slowdown. A tight monetary policy, strict credit ceilings,
and administrative price controls have been keeping inflation below 5 percent in recent years. China’s
currency, the renminbi, has been stable for two years, but the government is under growing pressure to
devalue it. Gross domestic product (GDP) per capita is low ($770 in 1998) but is growing rapidly.
Growing unemployment as well as interregional and intraregional income disparities represent serious problems
for the Chinese economy. Average per capita income is 2.5 times higher for urban residents than for the rural
population. China’s chronic and growing labor surplus is not reflected in the official unemployment rate of
4 percent. Approximately 23 million people are underemployed in the state sector, and another 80-120 million
surplus rural workers take occasional agriculture or construction jobs (U.S. Department of State, 1998c).
Privatization. Growth rates in different industrial sectors continue to shift the composition of the economy
from the public to the private sector. The government has made serious efforts to downsize the large state
sector, and many state-owned enterprises have been sold or closed. However, there is no clear privatization
policy. State-owned enterprises are protected from competition by laws and regulations, and the state retains
a leading role in every key industry. The current policy of administrative price controls is at odds with the goal
of achieving greater economic efficiency through market-oriented reforms. The Chinese Government is taking
initial steps toward restructuring the power sector.
Trade and Investment Policy. China is currently negotiating entry into the World Trade Organization (WTO),
which would recognize its role as a major trading nation. The WTO membership would require China to revise
and reduce most of its trade barriers. Presently, import tariff rates are divided into two categories: the general
tariff and the minimum or most-favored-nation tariff. Imports from the United States are assessed at the minimum
tariff rate due to the U.S.–China agreement containing reciprocal preferential tariff clauses. In addition, there is a
17 percent value-added tax on imported items. The five Special Economic Zones (Dalian, Tianjin, Shanghai,
Guanzhou, and Hainan), open cities, and foreign trade zones offer preferential duty reduction or exemption.
China also administers a complex system of nontariff trade barriers that include import licensing, quotas, and
administration controls such as import registration. The United States is putting considerable pressure on China
to reduce tariffs, phase out nontariff import restrictions, publicize all trade-related regulations, and grant
unconditional national treatment to foreign investors as a prerequisite of its accession to the WTO.
Since the beginning of its economic reforms in 1978, China has actively sought foreign direct investment (FDI)
to promote its modernization efforts and accelerate its export trade capabilities. China has been successful in
attracting foreign investment and has become the second largest recipient of FDI in the world, after the United
States. Actual U.S. investment in China has grown every year since 1992 to reach a total of $14.1 billion,
making the United States the largest overseas investor in China (U.S. Department of State, 1998c).
China has opened a number of sensitive sectors to investment on an experimental and limited basis and has
introduced new incentives for foreign investors designed to modernize Chinese industry. Most of the
investment has been in coastal regions and the five Special Economic Zones. The government continues to
pursue reforms in foreign exchange controls, taxation, foreign trade, and state enterprise restructuring which
affect the foreign investment climate. In 1996, China announced full convertibility of its currency on the
current account and instituted new, more liberal regulations allowing foreign-invested and domestic
enterprises to freely convert currencies for current account transactions.
However, China’s restrictive foreign trade and investment regulations deny foreign companies national
treatment in almost all industry and service sectors. There is also a general lack of transparency and
inconsistent enforcement with regards to China’s legal and regulatory system, which leads to ambiguities
and excessive bureaucratic influence.
Political Situation. Since 1998 China has begun reorganizing and downsizing its central government
bureaucracy to increase the efficiency of the government apparatus. Although China has been pursuing
economic reforms for the past 20 years, the country’s political system remains unchanged. Major decisions
are still made by key leaders of the Chinese Communist Party. Senior political figures in China generally
agree on the need for further economic reforms, but stability remains a dominant concern, and there are
significant differences within the country’s leadership over the content, pace, and the ultimate goal of the
reforms.
Under the 1984 Sino–British Joint Declaration, Hong Kong became the Special Administrative Region of the
People’s Republic of China on July 1, 1997. The Joint Declaration and the Basic Law promulgated by China
in 1990 established the concept of “one country, two systems” under which Hong Kong is guaranteed a high
degree of autonomy except in foreign affairs and defense. Hong Kong’s social and economic system, lifestyle,
and rights and freedoms will remain unchanged for at least 50 years.
Between the normalization of bilateral relations in 1979 and the suppression of the Tiananmen Square prodemocracy
protests in 1989, the United States and China signed many bilateral agreements, especially in the fields of
scientific, technological, and cultural interchange and trade relations. In 1989, the U.S. Government responded
to the political repression by suspending certain trade and investment programs. Currently, despite ongoing
economic cooperation, there is a serious political tension between the two countries caused by the
unintentional North Atlantic Treaty Organization (NATO) bombing of the Chinese Embassy in Yugoslavia
and the suspected Chinese nuclear technology espionage in the United States.
Overview of Energy Supply and GHG Sources
Energy Supply. China is the second largest energy consumer in the world. Its energy consumption has been
growing by an average 4.5 percent per year for the past 15 years. Coal is by far the largest fuel source in China:
it comprises over 60 percent of the total primary energy supply (see table 6). In power generation and
manufacturing, coal contributes as much as 75 percent of the fuel supply. As the Chinese Government pursues
an ambitious industrialization program based in large part on the use of its indigenous fuels, coal consumption
in China is expected to increase sharply in absolute terms in the coming years. Furthermore, the relative share
of coal in the energy balance is also increasing due to its abundance (China is the largest coal producer in the
world). Oil and natural gas cannot compete with coal: proven oil reserves in China are less than 1 percent of
proven coal reserves, and proven reserves of natural gas are about 0.25 percent of proven coal reserves. China
has a great hydro resource potential, but most additional resources are in the southwestern part of China, far
away from the major demand centers in the eastern part of the country.
Whereas urban areas in China consume almost exclusively commercial energy, in rural areas biomass
(firewood, straw, and stalks) is the main energy source. Biogas generation in China ranks the first in the
world: in 1994, there were 5.4 million biogas digesters for household use in China’s rural areas.
Despite the abundance of energy resources, China regularly faces energy shortages, mainly due to the high
inefficiency in the energy use. The inefficiency stems from artificially low energy prices (providing little
incentive to save energy), obsolete equipment, and a low level of technological development.
GHG Sources. China is the second largest GHG emissions producer in the world, responsible for over 14
percent of the world’s total. China’s contribution to global emissions is expected to reach 15 percent by 2000
and 25 percent by 2050.
Table 6 - China’s Primary Energy Supply by Source, 1994
Energy Source | Supply, million tons of oil equivalent | Share of total supply, % |
| Coal | 614.7 | 63.4 |
| Oil | 146.1 | 15.1 |
| Natural Gas | 16.4 | 1.7 |
| Nuclear Power | 3.6 | 0.4 |
| Hydropower | 14.5 | 1.5 |
| Biomass | 174.1 | 17.9 |
| Other | 0.0 | 0.0 |
| Total | 969.4 | 100.0 |
Source: International Energy Agency, 1997.
Coal is by far the highest contributor to energy-related CO2 emissions in China. In 1993, it accounted for 83
percent of the total. On a sectoral level, the main contribution to CO2 emissions comes from industry (see
figure 3), with cement manufacturing, iron and steel, and chemical industries being the largest emitters. The
transportation and residential sectors are not major sources of GHG emissions. According to projections,
the transport sector will still account for only 5 percent of CO2 emissions by 2020.
Figure 3 - Sources of China’s CO2 Emissions, 1993
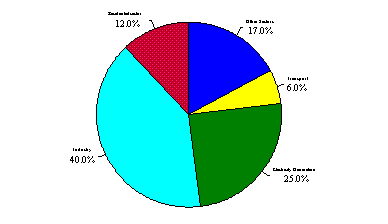 Total: 2625.4 million tons
Source: International Energy Agency, 1996.
Market Drivers
Climate Change Policies. China ratified the UNFCCC in January 1993 and signed the Kyoto Protocol in May
1998. China, like India, is a strong opponent of introducing GHG reduction commitments for developing
countries.
In 1994, China published its “White Paper on Population, Environment, and Development in the 21st Century,”
which identifies the following priority programs for climate change mitigation:
Cleaner production of coal-generated electricity;
Promotion of solar, wind, and biomass power; and
Public transport planning.
China’s State Science and Technology Commission has conducted a two-year climate change country study
with the support of the U.S. Country Studies Program. The National Climate Change Coordination Office
(established as early as 1990) coordinates ministries and government agencies in their efforts to address
climate change. Its four working groups deal with scientific assessment; impact assessment and response
strategies; economic implications of climate change; and matters related to UNFCCC implementation. The
office is located in the China Meteorological Administration.
Over the last two decades, China has promulgated several pollution control statutes, some of them affecting
GHG emissions. For example, the National Standards for Air Pollutants from Coal-Fired Power Plants went into
effect in 1997.
China’s Trans-Century Green Project is an important component of the Ninth Five-Year Plan (1996–2000). The
Green Project identifies approximately 30 initiatives that specifically address GHG emission reductions.
Energy Policies and Programs. Although the Chinese Government has been implementing an energy
efficiency program since the 1980s, one of the most important of China’s legislative efforts to reduce GHG
emissions is the new Energy Conservation Law, which went into effect on January 1, 1998. The law requires
the government to formulate an energy conservation policy and incorporate it into the national economic
plan. Other actions required under the law include the development of national energy efficiency standards,
increased investment in cleaner fossil fuel-based energy generation and renewable energy, and the replacement
of obsolete technologies with new, cleaner ones.
China has already adopted energy efficiency building codes and standards for electric appliances. It has
also developed detailed targets, guidelines, and standards for energy consumption in industrial enterprises.
Established in 1996, the China Green Lights Program targeting high-efficiency lighting is one of the country’s
key national energy conservation programs for the Ninth Five-Year Plan. The New and Renewable Energy
Development Program announced in 1995 by the Chinese Government seeks to lower production costs and
increase the contribution of renewable energy resources to the overall energy supply.
The institutional framework for energy conservation in China includes a number of specialized energy
conservation units at the national, provincial, and local levels, operating under the State Economic and Trade
Commission and provincial and local Economic Committees, respectively. China’s energy conservation
policies are also supported by the Beijing Energy Efficiency Center (founded in 1993), which promotes energy
efficiency projects throughout the country; the China Energy Conservation Investment Corporation (founded
in 1994), which invests in energy conservation projects in industry; and the Energy Conservation Information
Dissemination Center (established in 1998).
China started to restructure its power sector in 1998,when it replaced the omnipotent Ministry of Electric Power
with the State Power Corporation to facilitate market-based reforms and investment in the power industry. The
next step is expected to be the creation of a competitive generation market, separate from power transmission
and distribution. These reforms have the potential to enhance energy efficiency and reduce GHG emissions in
the power sector over the next decade.
China has also undertaken energy price reforms. Subsidies for coal declined from 37 percent in 1991 to
29 percent in 1995; total fossil fuel subsidies fell from 42 percent in 1991 to 20 percent in 1995. The average
retail energy price is now at or above the cost of supply. In 1994, China increased taxes on gasoline by
17 percent and on diesel oil by 13 percent. As a result, the consumption of these two fuels dropped from
38 million tons in 1994 to 27 million tons in 1995 (Hagler Bailly, 1999).
Targeted Donor Funding. Currently, there is about $600 million worth of climate change-related projects in
China sponsored by the World Bank and Global Environment Facility (GEF). The Asian Development Bank’s
contribution is much smaller, and USAID does not provide aid to China. Overall, donor funding is a major
market driver with respect to the additional climate change market in China, as most of the government funding
goes to programs that have primarily macroeconomic objectives.
Market Opportunities
China has the biggest potential climate change mitigation technologies market in the developing world. This
status is due both to the size of the Chinese economy and population, and to the great potential for GHG
emission reduction. The main elements of this market are advanced coal combustion technologies and
energy-efficient technologies in the manufacturing, commercial (primarily in Hong Kong, Beijing, and Shanghai),
and residential sectors. The 1996 total energy efficiency market in China was estimated at almost $1.8 billion.
Currently, China represents a big market of donor-funded projects with specific climate change-related
components. The future additional climate change market in China will depend on the Chinese Government’s
willingness to participate in the Clean Development Mechanism (CDM) and the overall improvement of
China’s business climate.
Energy Supply Sector. In the future, coal-fired thermal power will continue to play an irreplaceable role in
China’s power generation, creating an enormous market for advanced coal combustion technologies.
Coal-fired power plant efficiency improvements are likely to become prime candidates for future CDM projects.
The priority technologies in the energy supply sector include large-sized PFBC (pressurized fluidized bed
combustion) units and IGCC (integrated gas combined cycle) generating technologies.
Energy efficiency consulting services to electric utilities are also in demand. Technical assistance is part of
many donor-funded projects in China. For example, the ADB Power Rehabilitation and Environmental
Improvement Project will carry out detailed feasibility studies of several coal-fired power plants that were
identified as candidates for possible renovation or retrofits.
China has great potential for hydropower development, although, as mentioned earlier, its geographic
distribution is extremely unfavorable. Technologies for hydropower equipment manufacturing and
hydropower station design and construction are mature in China, and are 90 percent domestically sourced.
Therefore, the hydro projects that are currently planned in China do not represent a significant import market
for U.S. companies.
Although non-hydro renewable energy is an important supplement to commercial energy, renewable energy
units currently used in the country are technologically immature, have low conversion efficiency and high cost.
This situation represents a substantial market opportunity in wind, solar, and biomass energy generation.
China’s wind energy market has historically been developed for small-scale applications of domestically
manufactured wind turbines. Recently, however, demand for larger (300–600 kW), imported wind turbines
has increased. China has set a target of installing 1,000 MW of wind power capacity by 2000, which would
require an investment of over $1.2 billion.
The solar energy market focuses on solar buildings, solar water heaters, and photovoltaic (PV) power systems
for remote areas where no grid power exists. For example, it is expected that installed PV capacity will reach
10–20 MW by 2000 and 60–120 MW by 2010.
The Renewable Energy Development Project supported by the World Bank and the GEF ($135 million, 1999–
2004) will promote the development of state-of-the-art wind and solar photovoltaic technologies. The project’s
goal is to install grid-connected wind farms with a total capacity of 190 MW in four Chinese provinces and to
supply about 200,000 PV systems to households and commercial buildings in remote areas of China. The ADB
Wind Power Development Project ($0.6 million, 1998–1999) is providing technical assistance to the provincial
governments in expanding one existing wind farm in the Xinjiang Autonomous Region and developing new wind
farms in Liaoning and Heilongjiang provinces. These projects can be regarded as part of the additional climate
change-related market.
Among biomass energy applications, direct burning for household cooking and space heating in rural areas is
being replaced by sophisticated biomass gasification technologies. There is a growing market for rural household
biogas digesters and large- and medium-sized biogas plants.
Manufacturing Sector. Improving the efficiency of industrial boilers is a major market opportunity in China.
China’s more than 400,000 medium- and small-scale industrial boilers account for around 35 percent of the
country’s coal use and about 30 percent of GHG emissions from energy consumption. Typical efficiency
levels for Chinese coal-fired boilers are 60–65 percent, whereas in developed countries, this indicator exceeds
80 percent (Hagler Bailly, 1999). The World Bank/GEF Efficient Industrial Boiler Project ($101.4 million,
1996–2001) is expected to affect approximately 20 percent of the total industrial boiler output in the country
over the next 20 years. The technological upgrades are being complemented by a training and dissemination
program. The annual market for efficient industrial boilers is estimated at $102 million.
There is also a big market for high-efficiency motors and adjustable speed drivers (ASDs). The application
of ASDs is being promoted by the Chinese Government and has the biggest market in the oil, cement, and
chemical industry. The market size for these technologies is valued at about $187 million per year (Hagler
Bailly, 1997).
The World Bank/GEF China Energy Conservation Project ($202 million, 1998–2004) supports the establishment
of energy service companies (ESCOs) in three provinces. Through energy performance contracting, the ESCOs
will undertake a large backlog of energy efficiency projects in industry, including electric furnace renovation,
electric motor upgrades, insulation of pipes and furnaces, and boiler renovations. The World Bank estimates
that these three companies will undertake projects valued at $730 million between 1997 and 2006.
Some donor-funded industrial pollution control projects in China facilitate investments in industrial process
improvements that lead to GHG reductions. For example, the World Bank’s Chongqing Industrial Pollution
Control and Reform Project (1996–2001) is investing in energy-efficient production technologies in the
province’s highly polluting iron and steel industries.
Commercial and Residential Sectors. Lighting is one of the largest energy efficiency market segments in
China. Its annual size is estimated at $280 million, of which Hong Kong, with its burgeoning commercial
sector, accounts for $203 million (Hagler Bailly, 1997). China’s Green Lights Program seeks to increase the
number of high-efficiency lights used in the commercial and residential sectors and stimulate production of
compact fluorescent lamps (CFLs). The best market prospects include thin-tube fluorescent lamps, CFLs,
and energy-saving halogen lamps.
There is also a booming baseline market for energy-efficient household appliances, which is a result of China’s
adoption of minimum efficiency standards for refrigerators, air conditioners, clothes washers, fans, rice cookers,
and irons. The total market for energy-efficient air conditioners is estimated at $287 million per year (Hagler
Bailly, 1997). However, the import market for efficient appliances is limited by strong local competition (e.g.,
China is the largest manufacturer of refrigerators in the world).
Transportation Sector. The additional market for GHG-reducing technologies in the transportation sector
is relatively small in China, since this sector’s relative contribution to the country’s GHG emissions is just
6 percent, and most climate change strategies target other sectors. The World Bank and other donors are
implementing or planning several transportation infrastructure development projects (e.g., the World Bank’s
Liaoning Urban Transport Project) that will have a positive climate change impact. However, they are being
pursued for other objectives. Another example of the baseline market in China’s transportation sector is the
demand for high-efficiency trucks to replace the existing Chinese-made trucks of poor technical quality.
Best Prospects: China
Energy Supply Sector: Clean coal technologies (fluidized bed combustion, and IGCC), wind, solar, and biomass energy technologies, and consulting services.
Manufacturing Sector: Efficient boilers, motors and adjustable speed drivers, industrial process improvements (e.g., in the iron and steel industry).
Commercial and Residential Sectors: Energy-efficient lighting, air conditioners, and household appliances.
Transportation Sector: Transportation management consulting services. |
India
Business Climate
Economic and Social Indicators. India is one of the largest economies of the world, yet its per capita GDP
is one of the lowest at just over $400. Despite heavy investment in the industrial sector, the Indian economy
is still based on agriculture, which employs 70 percent of the country’s work force. Unemployment is very
high — 22.5 percent.
Economic reforms undertaken by India since 1991 have led to stronger economic growth, higher investment
flows, and growth in trade. GDP growth was 5 percent in the Indian fiscal year (IFY) 1997–98 and is projected
at 6.5–7 percent for IFY 1998–99. The slowdown has been attributed to a fall in agricultural output and a
significant reduction in growth of industrial production. The economy has also been affected by high interest
rates; a large government fiscal deficit and inadequate infrastructure; the Asian economic and financial crisis;
and the international reaction to India’s 1998 nuclear tests and resulting sanctions. However, India’s modest
current account deficit and its low level of short-term foreign debt enabled the country to withstand the
pressure with only a modest impact. Inflation rates have remained moderate, at 7–9 percent (U.S. Department
of State, 1998d).
Privatization. The government continues to be the largest player in India’s economy. A very limited public
sector disinvestment program seeks to gradually diminish this role. Power sector restructuring programs that
allow private participation in power generation and distribution have been launched in a number of states.
Although the government has recognized the need for privatization of its almost 250 public sector companies,
political sensitivities regarding the importance of the public sector and the employment issue have prevented
the process from moving forward. There is also opposition to reducing subsidies to state-owned enterprises.
Trade and Investment Policy. India’s Export–Import Policy for 1997–2000 signified a move in the direction of
a more liberal trade regime. India has recently reduced tariffs and removed quantitative restrictions on many
items. However, it still restricts consumer goods and agricultural imports. Quantitative restrictions still apply
through a negative or restricted imports list. Tariffs are still high enough to remain a serious impediment to
trade. Tariff rates have been reduced from a peak rate of 300 percent in 1991 to a ceiling of 40 percent in the
1997–98 budget but are still among the highest in the world, despite India’s membership in the World Trade
Organization. In September 1997, the government announced an additional 3 percent special customs duty
on most nonpetroleum imports. An 8 percent additional import duty was imposed in the budget of 1998
on approximately one-third of all imports. Imports into India require a license, with the majority of all imported
items falling within the unrestrictive Open General License.
The new industrial policy introduced in 1991 marked a major shift in India’s investment climate, relaxing or
eliminating many restrictions on investment and simplifying the investment approval process. The government
has expanded the list of industries eligible for automatic approval of foreign investments and has also raised
the upper level of foreign investments from 51 to 74 percent. Foreign investment up to 100 percent is permitted
in Export Processing Zones and Export Oriented Units. New industrial establishments in Free Trade Zones are
entitled to complete exemption from income tax on business income. However, many of the investment policy
changes have not yet received legislative sanction and are yet to be fully implemented. Foreign direct
investment in India rose from $2.7 billion in IFY 1996–97 to $3.1 billion in IFY 1997–98 (U.S. Department of
State, 1998d).
India has signed bilateral investment treaties with several countries, including the United Kingdom, France,
Germany, and Malaysia. The United States and India still have not negotiated a similar treaty, although an
updated agreement covering operations in India of the U.S. Overseas Private Investment Corporation was
signed in 1997. In addition, India is not a member of the Paris Convention on intellectual property protection
and does not have a bilateral patent agreement with the United States, which hampers U.S. investment in India.
Political Situation. The economic reform program to move India from a planned to a market economy was
initiated by the Congress Party government in 1991. Although the last government led by the Bharatiya
Janata Party (BJP) took a more nationalistic stand and advocated a protectionist “swadeshi” (made in India)
approach to the economy, it continued to pursue economic reforms and encouraged foreign investment in
core infrastructure sectors. As part of India’s long-time confrontation with Pakistan, the BJP government
conducted a series of nuclear tests in May 1998 that resulted in the imposition of economic sanctions by
many countries, including the United States. Although the Indian Government is trying to downplay the
negative effect of the sanctions, they are certainly taking a toll on the country’s economy as a whole (due to
reduced foreign financial assistance) and the U.S.–India trade and investment climate.
The BJP government fell in a no-confidence vote in April 1999 after only a year in power, but was reelected
by a wide margin in the fall of 1999. India’s pluralistic politics and democracy make all major policy decisions
open to a long stakeholder dialogue. Disagreements and bargaining between the federal and state governments
are common, slowing down the adoption and implementation of government programs. Even though the general
economic course is likely to remain intact under a new government, the change may significantly affect the
business climate in India.
Overview of Energy Supply and GHG Sources
Energy Supply. Even though energy supply per person is very low in India — about one-sixth of the world
average — in absolute terms, India ranks among the world’s highest energy users. Currently, about 10 percent
of the energy demand is not met, and the country suffers from regular power shortages. India’s commercial
energy consumption is growing at an average annual rate of 6.3 percent. This rapid growth is closely tied to
India’s economic transition from agriculture to industry and to the general increase in the standard of living
and the shift toward a more Western-style consumption ethic.
Coal, being cheaper and abundantly available, dominates the total energy supply (31.5 percent of the total).
Its increase in supply over the years is due to the expansion of opencast mining. There has been a movement
away from crude oil to coal and, to some degree, to natural gas. Natural gas is a relatively new entrant in the
Indian energy supply balance, and its share is expected to grow (see table 7).
In addition to fossil fuels, India’s energy supply has always been, and still is, heavily dependent on biomass,
whether it be in the form of firewood, agricultural residues, or cow dung. Biomass fuel is very inexpensive and
readily available, and for a large number of inhabitants it is the only source of energy.
Table 7 - India’s Primary Energy Supply by Source, 1994
Energy Source | Supply, million tons of oil equivalent | Share of total suply, % |
| Coal | 134.1 | 31.5 |
| Oil | 70.0 | 16.4 |
| Natural Gas | 13.9 | 3.3 |
| Nuclear Power | 1.5 | 0.4 |
| Hydropower | 7.1 | 1.7 |
| Biomass | 198.1 | 46.5 |
| Other | 0.9 | 0.2 |
| Total | 425.6 | 100.0 |
Source: International Energy Agency, 1997.
At the end of 1997, India had over 870 MW of installed wind capacity, much of it in the southern part of the
country. This amount ranked India fourth in installed wind capacity behind only Germany, the United States,
and Denmark. However, the wind farms which were expected to operate at load factors of 25–30 percent have
instead been performing at an average 7 percent.
GHG Sources. In absolute terms, India is the world’s sixth largest emitter of greenhouse gases (4 percent of
the total). However, the per capita emissions are only about one-third of the world’s average. The average
annual GHG emission growth rate in India is 4.6 percent, compared to the world average of approximately
2 percent. The contributions of different economic sectors are presented in figure 4.
Electricity generation is the main source of GHG emissions in India, with coal combustion being the source
of about 70 percent of energy-related CO2 emissions. CO2 emissions from industrial processes are mainly
from cement production. Important sources of methane emissions include coal mining, rice fields, livestock,
landfills, and biomass burning.
Figure 4 - Sources of India’s CO 2 Emissions, 1993
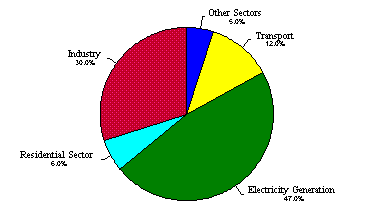
Total: 701.6 million tons
Source: International Energy Agency, 1996.
Market Drivers
Climate Change Policies. India ratified the UNFCCC in November 1993 but has not yet signed the Kyoto
Protocol. In international climate change negotiations, India has been a strong proponent of the position
that developed countries are primarily responsible for the current concentration of greenhouse gases in the
atmosphere and, therefore, have the obligation to combat these emissions first. So far, India has not
developed a national climate change policy. Although the Ministry of Environment and Forests is in charge
of climate change-related issues, they were not even reflected in the Ninth Five-Year Plan (1997–2002). India
is currently working on its first National Communication under the UNFCCC, including the preparation of a
GHG emissions inventory.
Energy Policies and Programs. Energy-related issues in India are covered by several ministries: the Ministry
of Power, which deals with most electricity-related issues; the Ministry of Coal; the Ministry of Petroleum and
Natural Gas; the Ministry of Atomic Energy; and the Ministry of Non-conventional Energy Sources, which is
in charge of renewable energy development.
India’s perpetual race to narrow the energy demand– supply gap resulted in suboptimal decision-making in
almost all energy sectors: hydropower development lost to thermal power plants; generation capacity took
precedence over proper maintenance and reduction of losses in the transmission and distribution network;
and the focus of energy planning was on supply enhancement with little or no attention given to demand
management. However, the government has been gradually reducing energy subsidies: from 25 percent in
1991 to 19 percent in 1996.
Restructuring of the State Electricity Boards has been initiated in several states, including Orissa, Haryana,
and Andhra Pradesh. The restructuring process separates generation, transmission, and distribution
operations, and introduces competition by allowing private participation in generation and distribution.
Recent developments such as the rationalization of fossil fuel prices and the government’s interest in
promoting renewable energy to reduce energy shortages facilitate the development of renewable energy
sources. The Ministry of Non-conventional Energy Sources coordinates several government renewable
energy programs and encourages the active involvement of the private sector. The ministry’s major programs
include the subsidy-based National Program for Biogas Development promoting the use of family-size
biogas plants and programs supporting solar thermal and solar photovoltaic applications.
The Indian Renewable Energy Development Agency (IREDA) has an important financial base, having funds
from the government and donor agencies. For example, biogas plants are eligible for low interest rates and
financing of up to 80 percent of plant installation costs from IREDA. The central government has also
sponsored investments in several grid-connected wind turbine projects. Other financial incentives
encouraging the development and use of renewable energy sources include a 50 percent subsidy for small
hydropower projects, 100 percent depreciation on renewable energy installations and equipment, among
others.
Targeted Donor Funding. Donor funding is an important market driver in India’s climate change-related
market. Climate change projects were not affected by sanctions imposed on India as a result of its 1998
nuclear tests. The World Bank and Global Environment Facility (GEF) are by far the largest donors for this
type of projects in India. The current portfolio of World Bank/GEF-supported projects (including local funding
components) exceeds $1 billion.
The active role of USAID in promoting climate change mitigation in India creates a particularly favorable climate
for U.S. firms in this market. USAID is currently implementing the eight-year (1997–2005), $39 million Greenhouse
Gas Environmental Pollution Prevention Project (GEP). Initially, the GEP focused on two areas: increasing
efficiency in coal-fired power plants and cogeneration of power from biomass in the sugar industry. Starting in
1999, several other components have been added to the project, including the U.S.–India Climate Change
Partnership, a major technical assistance package. For example, USAID is working with the Government of
India to promote climate change policies under its Climate Change Outreach and Awareness (CCOA) activity.
It will also develop and implement a pilot carbon emissions trading program in India as part of the Clean
Technology Initiative.
Market Opportunities
India is a huge market for energy efficient and renewable energy technologies. The general energy efficiency
market (unrelated to climate change initiatives) is estimated at $486 million per year. However, the additional
climate change market is much smaller and is primarily donor-driven. The market of CDM projects is likely to
be quite substantial but not in the short term, as it will take a few years for India to develop a national
climate change/CDM program.
Energy Supply Sector. The large number of efficiency improvement opportunities that directly lead to GHG
emission reductions make the energy supply sector a prime candidate for future CDM projects. Some studies
estimate the total market for CDM energy supply projects in India at $18.8 billion over the next 10 years.
Although this number probably represents the higher end of the range of estimates, it is indicative of the hefty
size of the energy supply sector.
Indian coal is characterized by very high ash content (about 40 percent), which reduces the efficiency of
power generation and increases CO2 and sulfur dioxide (SO2) emissions. These emissions may be reduced
to up to 5 percent by using coal beneficiation (also known as coal washing). In India, this technology is
currently limited to the steel sector but has great market potential in the power sector, especially through
CDM projects. There is also potential for other efficiency improvements in coal-based power generation,
such as coal washing and fluidized bed combustion, both for retrofits and new projects.
Under the GEP, USAID is working with the National Thermal Power Corporation, India’s largest utility, and
the State Electricity Boards to conduct efficiency improvement projects at several coal-fired power plants.
USAID is also promoting, through feasibility studies, the use of clean coal technologies in new power plants
planned by the Indian partner utility companies.
The market for replacing coal-fired with gas-fired power plants is limited to plants that are more than 20 years
old and need repairs and retrofits, as well as to coastal areas around the existing liquefied natural gas (LNG)
import terminals. (India has very few appropriate port facilities and regasification facilities.) Good opportunities
exist in the states of Tamil Nadu, Karnataka, Andhra Pradesh, and Gujarat.
The United States Energy Association (USEA), with USAID funding, is forging strong partnerships in the Indian
power sector. The primary goal of these partnerships is to assist Indian power companies in promoting more
efficient, environmentally sound energy supply and use by transferring commercially viable, market-oriented
energy management approaches. As of April 1999, eight such partnerships have been formed, and a few more are
in the works. These partnerships enhance the market for U.S. suppliers of GHG-reducing technologies in India’s
energy supply sector.
Due to the extensive government support for the development of renewable and nonconventional energy
sources, India presents great market opportunities for renewable energy technologies, including biogas plants,
solar thermal technologies (cookers, dryers, and hot water systems for industrial, commercial, and residential use),
wind power installations, and small hydropower stations. The Ministry of Non-conventional Energy Sources has
planned for 3,000 MW of grid-tied applications to be sourced from wind energy, biomass, and micro hydroelectric
systems in the Ninth Five-Year Plan (1997–2002). This plan represents a 200 percent growth over the existing
capacity. The investment potential for renewable energy technology is estimated at $25 billion over the next 10
years (CAS, 1999), although only a fraction of it may be regarded as the additional climate change market.
There are a number of multilateral donor projects that promote the commercialization of renewable energy
technologies in India. The $430 million Alternate Energy Project (1993–2000) supported by a $26 million GEF
grant and implemented by IREDA focuses on wind farms and solar photovoltaic power systems. The GEF is also
co-financing (with a $49 million contribution) the construction and operation by the private sector of a 140 MW
solar thermal/fossil fuel hybrid power plant in Rajasthan. Both the World Bank’s $170 million India Renewable
Energy II project and the GEF/United Nations Development Programme (UNDP) $14.6 million project in the hilly
regions promote the use of small hydroelectric power plants.
India is actively looking for ways to reduce high technical and nontechnical losses in its power transmission
and distribution systems to narrow the gap between supply and demand. Apart from the significant investment
potential for technical transmission and distribution improvements, there is a market for energy audits of electric
utilities to identify loss reduction options. Such projects are being implemented through State Electricity Boards.
Good opportunities for this market exist in the states of West Bengal, Kerala, Haryana, and Punjab.
Manufacturing Sector. There is a significant potential for CDM projects in India’s energy-intensive industries,
including cement, caustic soda, steel, nonferrous metal (primarily aluminum), and paper manufacturing. CDM
market potential in the manufacturing sector is more long-term and smaller than in the energy supply sector,
since it is more difficult to prove “additionality” of such projects and verify GHG emission reductions. The
CDM market in the manufacturing sector has been estimated at $850 million over 10 years (CAS, 1999).
The main market opportunities lie in cogeneration and industrial process improvements. Examples of
successful cogeneration projects conducted in different industries include:
Two sugar mills in the state of Maharashtra (generating nearly 1.5 MW of surplus power);
A paper mill (J.K. Paper Mills) where cogeneration meets 60 percent of the power demand;
A sponge iron plant (Prakash Industries) where a waste heat recovery system has been installed to
produce steam for electricity generation; and
A petrochemical plant of the Indian Petrochemical Corporation in Vadodara which has achieved energy
self-sufficiency through cogeneration.
Many large plants (e.g., those in the paper industry) already have cogeneration facilities, although there are
still many market opportunities to be explored. Medium-sized plants represent an almost open field of
cogeneration projects. The baseline annual cogeneration market was estimated at $29 million in 1996.
Examples of industrial process improvements include the conversion from the wet process to the dry process
in cement manufacturing, reduced fuel consumption in integrated steel plants, etc. The market for process
controls across all industrial sectors is very substantial — over $100 million annually (Hagler Bailly, 1997).
However, this market estimate is unrelated to climate change initiatives.
Donor funding is also available in this market segment. For example, the GEF-supported India Energy
Conservation Project (which is currently being developed) will supply a line of credit to finance industrial
energy efficiency demonstration projects and provide energy efficiency services to small and medium-sized
enterprises. This project has explicit GHG reduction objectives. In another example, the World Bank’s Power
Sector Restructuring Project in the state of Orissa (1996–2003, a total cost of $350 million) is funding, among
others, DSM investments in industrial motor efficiency.
A $150 million line of credit has been established by the Asian Development Bank for term lending for energy
efficiency and modernization projects sponsored by creditworthy Indian companies. The majority of loans to
date have been committed to projects in the cement, sugar, and iron and steel industries.
In addition, USAID is cooperating with the Industrial Development Bank of India in the sugar cane bagasse
cogeneration component of the GEP. Under this initiative, five sugar refineries are being assisted in adding
120 MW of bagasse-fired power, and four other sugar plants are under consideration to install an additional
100 MW of potential power from excess bagasse.
Commercial and Residential Sectors. Throughout India, a variety of energy efficiency projects are being
devised and implemented to narrow the gap between supply and demand for power. U.S. AID’s Sustainable
Cities Initiative promotes municipal, nongovernmental, and private sector investment in energy efficiency
and clean energy technologies. In Ahmedabad, USAID and the U.S. Environmental Protection Agency are
helping the Ahmedabad Electricity Company develop and carry out several pilot projects, including a pumping
system retrofit for use in low-rise residential multistorey buildings.
In addition, many large-scale power sector restructuring projects funded by primarily the World Bank include
DSM investments in the commercial and residential sectors. Such programs are currently under way in the
states of Orissa, Andhra Pradesh, and Haryana.
Lighting and building envelope represent the best opportunities in the market for energy efficiency and
clean energy technologies — the 1996 markets for these technologies were estimated at $130 million and
$128 million, respectively (Hagler Bailly, 1997).
Transportation Sector. The Indian Government is actively promoting the use of cleaner vehicles in the country.
All gasoline-driven government vehicles are required to be equipped with a catalytic converter or a compressed
natural gas (CNG) kit. The Gas Authority of India has set up CNG dispensing facilities in Mumbai, Delhi, and
Vadodara. The market for CNG-powered vehicles is expected to grow slowly, however, as India lacks adequate
infrastructure for CNG supply.
In New Delhi, the local government has imposed restrictions on commercial vehicles, including phasing out
vehicles that are more than 15 years old. These restrictions have created a market for vehicles with improved
technical efficiency characteristics; it is estimated that the most fuel-efficient car on the Indian market is about
twice as fuel-efficient as the current fleet average (CAS, 1999).
There is also a good market for transportation management consulting services. India is taking steps to initiate
national highway projects through private sector participation that would alleviate traffic congestion and
vehicular pollution in urban areas. Examples include bypass projects in the states of Maharashtra and Rajasthan
and an overpass project in Gujarat.
Despite these general opportunities, the additional climate change-related market in India’s transportation
sector is currently limited to donor-funded initiatives. One such initiative is being planned by USAID under
the GEP. USAID is designing a fuel switching program (to natural gas or electricity) aimed at New Delhi’s
public transportation vehicles that run on two-stroke engines (auto-rickshaws). This effort will be complemented
by a traffic flow management program in the city.
The additional climate change-related market segment is unlikely to grow in the near future. The current
government transportation improvement programs do not have GHG reduction objectives, and transportation
is not a priority sector for CDM projects due to the difficulties in quantifying potential emission reductions.
Best Prospects: India
Energy Supply Sector: Clean coal technologies (coal washing and fluidized bed combustion), renewable energy technologies, and consulting services.
Manufacturing Sector: Cogeneration, industrial process improvements (cement, caustic soda, steel, aluminum, and paper industries), and process controls.
Commercial and Residential Sectors: Lighting and building envelope.
Transportation Sector: Fuel-efficient and CNG-powered vehicles for government use, and transportation management consulting services. |
The Philippines
Business Climate
Economic and Social Indicators. Since 1992, the Philippines has embarked on a series of political and economic
reforms that have resulted in growing interest from potential foreign investors and renewed investor confidence
domestically. The Ramos administration (1992–1998) succeeded in liberalizing the trade, foreign exchange, and
investment regimes, privatizing many state-owned enterprises, improving the country’s long-term fiscal stability,
and implementing other market-based reforms.
The Philippines was heavily affected by the Asian financial crisis of 1997, which caused the depreciation of
the Philippine peso by 35 percent against the U.S. dollar. Economic growth, also affected by agricultural losses
due to El Nino, slowed down to about 2 percent a year, and inflation (9.5 percent in 1998) and unemployment
(10 percent) rose significantly. However, the prospects for resuming long-term economic growth are good,
provided structural and market-based reforms continue. One of the positive indicators is the fact that the
International Monetary Fund pulled out of Philippines in 1998 because it considered the country economically
stable. Already in 1999, gross domestic product (GDP) growth is projected to increase to about 3.5–4.0 percent,
and the rate of GDP per capita is expected to cross the $1,000 mark.
Privatization. Prices of goods and services in the Philippines are generally determined by free market forces,
with the exception of basic public utilities (transportation, water, and electricity), which are subject to government
control. Limited financial resources have forced the government to increasingly turn to the private sector: the
Ramos administration privatized a wide range of public sector controlled firms. Since 1996, the Philippine
Government has encouraged the build-operate-transfer (BOT) scheme as a means to attract private investment
to carry out important infrastructure (including energy) projects. As of mid-1998, there were 92 active BOT
projects. The BOT program has created a more confident and optimistic business environment in the Philippines.
However, BOT contracts can be awarded only to companies that are at least 60 percent Filipino-owned
(U.S. Department of State, 1998e).
Trade and Investment Policy. The Philippines is a founding member of the World Trade Organization. The
country is planning to adopt a uniform 5 percent tariff rate by the year 2004 and a two-tiered scheme of applied
tariffs of 3 percent for raw materials and 10 percent for finished products by January 2003. The Philippines’
average nominal tariff has been reduced to 11.24 percent in 1998, down from 27.84 percent in 1990. It is
expected to be lowered further to 9.08 percent by the year 2000. Additionally, all products, including imports,
are subject to a 10 percent value-added tax (VAT). There is also a 0–5 percent common effective preferential
tariff (CEPT), which the Philippines has started to phase in as part of the ASEAN (Association of Southeast
Asian Nations) Free Trade Area (AFTA). As a member of the Asia Pacific Economic Cooperation (APEC)
forum, the Philippines has committed to participate in the move toward the establishment of free trade in the
region. APEC members have until the year 2020 to eliminate their trade barriers (U.S. Department of
State, 1998e).
While progress in investment liberalization has been substantial, important barriers to foreign entry still remain.
The Foreign Investment Act of 1991 limits foreign investment in a variety of ways. It imposes a 40 percent
foreign ownership ceiling in certain sectors for reasons of national security, defense, public health, etc. Land
ownership by foreign entities is also limited. However, the Philippine Government recognizes the essential role
that foreign investment plays in the development of the Philippine infrastructure and is continually working on
liberalizing investment barriers. The Estrada administration is proposing to raise the 40 percent ceiling which
limits foreign entity’s equity participation in joint ventures, a common method of investment in the Philippines.
The United States is the Philippines’ largest foreign investor and had an estimated 29.4 percent share of the
foreign direct investment stock in 1997 (U.S. Department of State, 1998e).
Political Situation. Joseph Estrada was elected the new President of the Philippines in May 1998. Although
there had been some uncertainty before the elections regarding the continuation of the reforms begun under
the Ramos administration, Estrada has expressed a commitment to continue the market-based reforms and
follow Ramos’s basic domestic and foreign policy direction. President Ramos was successful in negotiating
peace settlements with various Muslim, communist, and military rebel groups, which have greatly reduced
political violence and created a more stable political environment. The new administration is expected to focus
on poverty alleviation, reform of the agricultural sector, and efforts against crime and corruption.
Over the last decade, U.S.–Philippine relations have improved and broadened, focusing more prominently on
economic and commercial ties while maintaining security cooperation (despite the recent closure of U.S. military
bases in the Philippines).
Overview of Energy Supply and GHG Sources
Imported oil and coal comprise roughly half of the Philippine energy supply (see table 8). Natural gas is not
yet used in the Philippines but it is going to play a fast-growing role in the Philippine energy balance in the
years to come. The first natural gas pipeline from an off-shore field developed by the Shell Corporation was
expected to become operational in 1999, and the Philippine Government wants to replace a significant share of
oil and coal imports with natural gas over the next 30 years.
The other half is renewable energy dominated by biomass (from agricultural residues, wood waste, and municipal
solid waste) and geothermal sources. Over the past five years, the Philippine National Power Corporation (NPC)
and the Philippine National Oil Company (PNOC) have been implementing the $1.3 billion Leyte–Luzon Geothermal
Project (currently being completed), which is supported by the World Bank and the Global Environment Facility.
The major part of the project was a BOT contract to build a 440 MW geothermal power plant that would supply
electricity to the Luzon region, including Metro Manila. The total amount of renewable resources used in power
supply (geothermal, biomass, and micro hydro) is expected to increase by 380 percent over the next 30 years
(Philippine DOE, 1996).
Table 8 - Philippine Primary Energy Supply by Source, 1994
Energy Source | Supply, million tons of oil equivalent | Share of total supply, % |
| Coal | 1.2 | 3.6 |
| Oil | 14.8 | 45.1 |
| Natural Gas | 0.0 | 0.0 |
| Hydropower | 0.3 | 1.0 |
| Biomass | 11.6 | 35.4 |
| Other Renewables | 4.9 | 14.9 |
| Total | 32.8 | 100.0 |
Source: International Energy Agency, 1997.
GHG Sources. The total energy-related GHG emissions in the Philippines are not very large and constitute only 28.5 percent of the entire net GHG emissions. Land use changes and forestry are considered major climate change factors, based on the most recent GHG emissions inventory for the Philippines prepared as part of the Asia Least-Cost Greenhouse Gas Abatement Strategy (ALGAS) project. Electricity generation
and transport contribute a combined 60 percent to the energy-related CO2 emissions due these sectors’ heavy reliance on oil products (see figure 5). Power industry GHG emissions are expected to increase fourfold in the next 10 years as a result of the country’s economic and population growth.
Figure 5 - Sources of Philippine CO2 Emissions, 1990
Total: 38.2 million tons
Source: Asian Development Bank, 1998.
Market Drivers
Climate Change Policies. The Philippines ratified the UNFCCC in August 1994 and signed the Kyoto Protocol in April 1998. The Philippine Government has also created an Inter-Agency Committee on Climate Change, which includes representatives of 12 national government agencies. The committee will oversee the implementation of climate change activities in the country. The Philippines has completed its national emissions inventory and a CO2 mitigation study, and is in the process of developing its National Action Plan on Climate Change. The government has also expressed its intention to develop a national CDM
program.
The proposal for the Philippine National Action Plan includes the following policy directions:
Gradual shift in the energy mix toward renewable energy;
Supply-side energy efficiency improvements, including power plant efficiency improvements, transmission loss reduction, and replacement of coal-fired plants with natural gas combined cycle plants;
Demand-side efficiency improvements, including energy efficiency and energy conservation measures
in industry and buildings;
Strict implementation of environmental pollution control regulations, including ambient air quality
standards, industrial emission standards, and vehicle emission standards; and
Traffic improvement schemes, including development and use of efficient mass transport systems.
Energy Policies and Programs. The Philippine Government’s current energy policies are formulated by the Department of Energy (DOE) and presented in the Philippine Energy Plan 1996–2025.
The Energy Plan outlines seven energy efficiency programs, including:
The Energy Audit Program, which will cover 1,000 industrial facilities with annual energy consumption
levels of one million liters of fuel oil equivalent and above;
The Financing Energy Conservation Program, which includes such financing schemes as DOE’s
Technology Transfer for Energy Management– Demonstration Loan Fund;
The System Loss Reduction Program for the country’s electric utilities;
The Room Air Conditioners Labeling Program;
The Vehicle Efficiency Standards and Testing Program;
The Heat Rate Improvement Program for power plants; and
An information campaign (Philippine DOE, 1996).
In addition, the Energy Plan envisions several demand side management (DSM) programs to promote high-efficiency motors and variable speed drivers for the industrial sector, and high-efficiency fluorescent lamps, air conditioners, fans, and refrigerators for the commercial and residential sectors. The Fuel and Appliance Testing Laboratory is charged with developing performance testing procedures, labels, and standards for a number of appliances. In 1995, the DOE issued a mandate for all Philippine utilities to create DSM plans.
In 1994, the Philippines adopted a building code (“Guidelines for Energy Conserving Design of Buildings
and Utility Systems”) for new buildings with energy use greater than 10 watts per square meter. The building
code covers building envelope technologies; lighting; and heating, ventilation, and air conditioning. However,
so far it has been poorly enforced.
The Energy Plan also promotes further development of renewable energy, including geothermal, biomass, wind,
solar, micro-hydro, and ocean energy. Executive Order 462 (1997) is also aimed at the commercialization of
renewable energy production. There are several projects to maximize the potential of cost-effective geothermal
power production. Plans have been developed to increase the installed geothermal capacity from 1414 MW to
2134 MW over the next decade.
The Energy Plan includes a proposal for the restructuring and privatization of the Philippine power sector which
is expected to be adopted shortly as the Omnibus Electric Power Industry Bill. Until recently, the NPC was a
monopoly for electricity generation, transmission, and bulk power distribution. It is currently being privatized
and restructured along the following lines:
NPC’s transmission functions will be transferred to an autonomous, independently managed, and
commercially operating subsidiary;
NPC’s generation capacity will be unbundled into a number of distinct generation entities and subsidiaries;
and
NPC’s power distribution functions will be delegated to independent distribution utilities. (There are
already 17 private utilities and over 100 electric cooperatives in the Philippine electricity distribution system.)
In privatizing the NPC, the Philippine Government is mainly using the build-operate-transfer (BOT) and
build-own-operate (BOO) models referred to earlier in this chapter. These reforms are expected to facilitate the
adoption of energy efficiency measures in the Philippine power sector.
The Philippine Anti-Pilferage Act of 1994 limits the level of system losses that private utilities and electric
cooperatives can recover through electricity rates. This regulation has created a market for transmission and
distribution improvements, which is expected to grow with the promulgation of the new Philippine Grid and
Distribution Code.
Targeted Donor Funding. The Leyte–Luzon Geothermal Project (1994–1999) was the only major Global
Environment Facility-supported investment project in the Philippines that had primary climate change mitigation
objectives. The Metro Manila Air Quality Improvement Investment Loan (1998–2003) of the Asian Development
Bank (ADB) has general environmental goals and will bring about substantial GHG emission reductions.
However, it is currently unclear whether more climate change-targeted investment funds are forthcoming from
multilateral donors in the near future.
On the other hand, USAID is very active in mitigating GHG emissions from the Philippine power sector, creating
market advantages for U.S. firms. USAID has developed a strategy that promotes more efficient electricity
generation, distribution, and consumption, and encourages private investment in the natural gas industry and
renewable energy development. It is currently funding a $8.9 million, three-year (1998–2001) Philippines Climate
Change Mitigation Program (PCCMP) that focuses on clean fuel power generation systems, energy efficiency,
and improved power sector policies and planning.
Market Opportunities
The Philippines has a substantial additional market for climate change mitigation technologies and services,
mainly due to the active position of the Philippine Government on climate change issues and its efforts to comply
with the Philippines’ commitments under the UNFCCC. This market is reinforced by the country’s progressive
energy policies that result in a large (considering the size of the Philippine economy) baseline energy efficiency
market — it was estimated at $128 million per year in 1996. The main opportunities for GHG-reducing technologies exist in the
energy supply, commercial, and residential sectors.
Energy Supply Sector. The private sector is expected to invest approximately $20 billion over the next decade
in clean and efficient power systems in the Philippines. The large investments anticipated in the natural gas
industry will create a market for fuel switching retrofits and advanced natural gas combustion technologies such
as gas combined cycle and fuel cells. Fuel cells can be used in power plants fueled by either natural gas or
renewable fuels. USAID is currently funding a specific market assessment for fuel cell technology in the
Philippines under the PCCMP.
There is also a market for power plant efficiency improvements at over 125 existing coal and oil-fired plants.
Most of these plants have low thermal efficiencies and high heat rates resulting from obsolete technologies
and poor management. Under PCCMP, USAID has funded audits at six power plants (two coal-fired, two
oil-fired, and two diesel-fired) that identified heat rate improvements that would lead to a total of 570,000 tons
of CO2 emission reductions per year.
As mentioned above, the new Philippine regulations for electricity transmission and distribution create a
substantial market for loss reduction improvements.
Renewable energy technologies will remain a major market opportunity in the Philippines. The greatest demand
is expected for biogas and geothermal power and heat generation technologies, although opportunities also exist
for micro hydro and wind power installations.
Manufacturing Sector. In the Philippine manufacturing sector, the main contributors to GHG emissions are the
cement and iron and steel industries. There is a market potential for process improvements and process controls
in these industries. The market for industrial process controls was estimated at $14 million in 1996.
Motors account for an estimated 70 to 80 percent of industrial electricity use in the Philippines (Wiel et al.,
1998). All the motors are imported, mostly from China, Taiwan, and South Korea. However, Philippine companies
tend to choose the least expensive equipment, which is often also the least energy efficient. The Philippines are
now considering introducing efficiency standards for electric motors, which would create a substantial baseline
import market energy-efficient motors. The annual size of this market is estimated at $10 million (Hagler Bailly, 1997).
Commercial and Residential Sectors. There is a fast-growing new commercial buildings market in the
Philippines that presents opportunities to influence the design process by incorporating energy efficient
technologies. Over 25,000 new buildings were constructed in the country during just the first three months
of 1997, of which 70 percent were classified as residential, 11 percent as non-residential, and the rest (19 percent)
were additions, alterations, and repairs. About 200 new large commercial buildings are planned to be built in
Metro Manila in the next five years. This growth, combined with the increasing enforcement of the building code,
represents a substantial market for heat, ventilation, and air conditioning, building envelope, and lighting.
For example, about 80 percent of large buildings and 45 percent of medium-sized and small buildings in the
Philippines use imported lighting fixtures and controls (Wiel et al., 1998). There are particularly good opportunities for
compact fluorescent lamps. The total lighting market is estimated at $10 million per year (Hagler Bailly, 1997).
Building envelope materials are currently manufactured locally, but as the commercial construction boom
continues, the market share of imported energy-efficient building envelope technologies is likely to grow. The
total market for building envelope (for domestic supply and imports combined) is estimated at $16 million annually
(Hagler Bailly, 1997).
Since June 1994, all room air conditioners sold in the Philippine market have to pass the mandatory minimum
efficiency standard set by the government. Relatively successful enforcement of this standard ensures that
most customers will purchase efficient units. The Philippine labeling program for window-type air conditioners
is one of the best in Asia, making them a good market opportunity in the commercial and residential sectors.
Good prospects are also expected for energy-efficient refrigerators, as a similar labeling program gets developed
and implemented for this type of appliances.
The Green Malls program started by MERALCO, one of the largest Philippine utilities, is an example of a market
opportunity in this market segment. Green Malls targets large shopping malls in Metro Manila and is intended as
a pilot project for a broader Green Buildings DSM program expected to be launched by the utility in the near future.
Transportation Sector. There is a significant market for transportation management consulting services in the
Philippines, especially in Metro Manila, where vehicles account for about 90 percent of air pollution. The ADB’s
Metro Manila Air Quality Improvement project (1998–2003, $122 million) includes a significant component supporting
public sector programs for traffic planning and management.
The Philippine DOE’s vehicle efficiency standards and testing program has also created a market for vehicles
with improved fuel efficiency characteristics. The best opportunities exist for fuel-efficient gasoline passenger
cars, diesel trucks, and gasoline utility vehicles.
Best Prospects: The Philippines
Energy Supply Sector: Fuel switching retrofits (from coal and oil to natural gas), advanced natural gas combustion technologies (e.g., combined cycle and fuel cells), heat rate improvements in power generation, and renewable energy technologies.
Manufacturing Sector: Energy-efficient motors, and process improvements and process controls in the cement, iron, and steel industries.
Commercial and Residential Sectors: Lighting, building envelope, and air conditioners.
Transportation Sector: Transportation management consulting services. |
South Africa
Business Climate
Economic and Social Indicators. South Africa is the most advanced, diversified, and productive economy in
Africa, with a gross domestic product (GDP) almost four times that of Egypt, its closest competitor on the
continent. South Africa’s GDP per capita is about $3,000. The country has a modern infrastructure and
well-developed financial, communications, energy, and transport sectors. South Africa’s stock exchange ranks
among the top 10–15 in the world.
At the same time, its economy has suffered from years of isolation and inward trade and investment policies, a
low savings rate, high levels of domestic debt, and a largely unskilled labor force. These factors have resulted
in a high dependence on foreign capital to finance necessary investments. An extremely high unemployment
rate of between 20 and 30 percent will remain a major challenge in the near future. It is estimated that the South
African economy must strive for growth between 5 and 10 percent to gradually solve the unemployment problem.
With the transition to a majority rule in 1994, South Africa has embarked on a process of structural transformation
of its economy aimed at redressing racial inequalities of the former apartheid system and fostering long-term,
outward-oriented growth. The economy has been heavily affected by the Asian economic crisis, Japan and Taiwan
being South Africa’s major trade and investment partners. The country is expected to start recovering from virtual
economic stagnation in 1998, with GDP growth for 1999 projected at about 2–3 percent (U.S. Department of State,
1998f).
Mining has traditionally played a key role in South Africa’s economy (it account for 8 percent of the GDP and
40 percent of the country’s exports). During the past decade, the mining sector has undergone a major shift
from gold to higher value-added mineral processing and manufacturing (steel, platinum, aluminum, and titanium).
In recent years, tourism became South Africa’s fastest-growing industry. The South African Government predicts
that by the end of the year 2000 tourism will replace gold as the country’s largest earner of foreign exchange.
Privatization. During the apartheid era, South Africa pursued a strategy of import substitution and industrial
development that protected local industries by means of high tariff barriers and heavy state involvement in
resource-based industries and manufacturing. This protection was achieved, to a large degree, by state
ownership of several key industries. The Mandela administration identified the need to restructure state
enterprises along commercial lines to foster competition and efficient use of resources, and to pave the way
for privatization. The government has reduced its role in the economy and now promotes private sector
investment and competition.
However, progress in privatization has been slower than expected. The state owns roughly half of the country’s
fixed capital assets, a quarter of which are parastatal companies. Partial privatization of state assets has been
done on an ad hoc basis and involved mostly “nonstrategic” companies. Privatization has been delayed because
the administration wants to ensure consensus among and inclusion of all stakeholders to sustain the momentum
of economic reform. The energy sector restructuring is stated as one of the government’s priorities but so far no
actions have been taken to launch a restructuring program.
Trade and Investment Policy. In keeping with its commitments to the World Trade Organization, South Africa
has sought to reform a complex tariff structure inherited from the apartheid-era governments. In recent years, the
government has been quite successful in simplifying and reducing its overall tariff code. The average tariff rate
has been reduced from about 20 percent to just over 12 percent. This lower percentage has met with resistance
from many industries previously protected by nontariff barriers and they have sought to increase tariffs again.
In spite of the fact that trade opportunities abound, there are still some remnants of the old system that need to
be addressed. U.S. exports to South Africa in 1997 totaled $3 billion, representing 47 percent of all U.S. exports to
Sub-Saharan Africa (U.S. Department of State, 1998f).
The South African Government treats foreign and domestic investment equally. Foreign firms receive national
treatment with respect to import incentive programs and tariffs, tax allowances, and other trade regulations. As
the government pushes ahead with plans to attract strategic equity partners for large state-owned companies, it
has shown more sensitivity to the concerns of foreign investors. Following the lifting of international sanctions
in 1994, foreign direct investment in South Africa has risen dramatically, with some of this surge attributed to
companies returning to the market after disinvesting earlier. South Africa has bilateral investment agreements
with most industrialized nations, including Canada and the European Union countries, but not with the United
States.
Political Situation. Since 1994, South Africa has undergone a historic transition from apartheid to a democratic
multiracial government under the administration of President Nelson Mandela. After general elections in June
1999, Mandela was succeeded by Thabo Mbeki, the former Deputy President and leader of the African
National Congress. One of the main challenges facing the government, along with huge unemployment, is the
high level of violence and the effect it is having on the business climate. Although political violence has
decreased, criminally motivated violence has increased and can be expected to persist throughout the country’s
period of transition to political maturity and social stability. South Africa has a 5 percent murder rate and the
highest rate of sexual attacks in the world.
The U.S.–South Africa Bilateral Commission cochaired by Vice President Gore and President Mbeki coordinates
and promotes relations between the two countries in trade and business development, energy, environment, and
many other areas.
Overview of Energy Supply and GHG Sources
Energy Supply. In 1993, South Africa accounted for 38 percent of the continent’s total energy supply, excluding
biomass. South Africa has large reserves of coal. Years of international isolation due to apartheid encouraged a
fuel mix that relies almost exclusively on indigenous resources. As a result, in 1994, coal made up over 70 percent
of the total primary energy supply (see table 9). About a third of domestic coal production is exported. Due to a
limited hydropower potential and small domestic reserves of oil and natural gas, coal will undoubtedly continue to
dominate other energy sources in South Africa for many years to come. Biomass is being used only as a
noncommercial energy source in the poorer, less developed areas of the country.
Table 9 - South Africa’s Primary Energy Supply by Source, 1994
Energy Source | Supply, million tons of oil equivalent | Share of total supply, % |
| Coal | 70.7 | 70.2 |
| Oil | 15.5 | 15.4 |
| Natural Gas | 1.7 | 1.7 |
| Nuclear Power | 2.5 | 2.5 |
| Hydropower | ~0.0 | 0.0 |
| Biomass | 10.3 | 10.2 |
| Total | 100.7 | 100.0 |
Source: International Energy Agency, 1997.
The energy intensity of the South African economy is about twice as high as the average of the Organization
for Economic Cooperation and Development (IEA, 1996). This high level is due to low energy prices, energy
lost in transformation, especially the conversion of coal to liquid fuels, and high energy consumption in the
industrial sector, which consists largely of extractive and energy intensive industries. In 1993, industry
accounted for 55 percent of final energy consumption (IEA, 1996).
GHG Sources. South Africa contributes almost half of Africa’s total CO2 emissions (about 1 percent of the
world’s total) and ranks 14th in the world. Electricity generation and combined heat and power production,
largely coal-based, accounted for 54 percent of energy-related CO2 emissions in 1993 (see figure 6). Coal
combustion is responsible for 91 percent of energy-related CO2 emissions.
Figure 6 - Sources of South Africa’s CO2 Emissions, 1993
 Total: 304.2 million tons
 Source: International Energy Agency, 1996
Market Drivers
Climate Change Policies. South Africa ratified the UNFCCC in August 1997 and is still considering whether to sign the Kyoto Protocol. South Africa has completed its national emissions inventory and is preparing its first National Communication under the UNFCCC.
The Department of Environmental Affairs and Tourism is the lead agency responsible for coordinating the implementation of South Africa’s UNFCCC commitments and other climate-change related matters. The National Committee on Climate Change (NCCC) was created in 1991 as an advisory body to the Minister of Environmental Affairs and Tourism in order to “coordinate the action required for formulating a broad national policy and strategy” on climate change. The NCCC consists of representatives of national and provincial government agencies, business community, labor unions, and environmental nongovernment
organizations.
In July 1998, the NCCC published a “Discussion Document on Climate Change” as part of the stakeholder
process leading to the development of a white paper — a principal government policy document in South
Africa. The white paper is expected to be published in 2000 and will emphasize the development of
energy-efficient technologies and energy resource conservation. However, the policy is likely to be relatively
general and include few, if any, specific government programs to mitigate climate change.
Energy Policies and Programs. South Africa pursues so-called no-regrets energy policies, which it defines
as those combining economic growth and cost-effectiveness with environmental impact minimization. In
December 1998, the Department of Minerals and Energy published white paper on the Energy Policy; which
states that the South African Government intends, among others, to:
Establish energy efficiency standards for commercial buildings and industrial equipment;
Implement an energy efficiency program to reduce energy consumption in government facilities;
Promote the introduction of a household appliance-labeling program; and
Promote the performance of energy efficiency audits, demonstrations, information dissemination, sectoral
analyses, and training programs.
South Africa recently launched the Green Buildings for Africa program. It is a market-based voluntary program
managed by the Buildings Technologies Division of South Africa’s largest research institute. One of its first
activities will be a showcase program of energy efficiency upgrades in several commercial buildings.
The South African Government is contemplating a power restructuring program and partial privatization of
Eskom, the national electricity monopoly. However, privatization in the power sector is facing strong opposition
from organized labor groups and is unlikely to be carried out in the near term.
Targeted Donor Funding. Donor funding is not an important driver in South Africa’s climate change mitigation
market. South Africa is not a major recipient of multilateral donor funds in general, and there are only a few small
technical assistance grants available from bilateral donors (including the United States) for climate change-related
activities.
Market Opportunities
At the present time, South Africa represents a relatively insignificant additional market for climate change
mitigation technologies and services. This situation is explained by the absence in South Africa of large
donor-funded projects specifically targeting GHG emission reductions, as well as the lack of specific government
programs on climate change and energy efficiency. However, should the South African Government decide to
take an active part in the CDM, there is a substantial baseline market to be tapped, particularly in the energy
supply and manufacturing sectors. Even though South Africa’s total annual energy efficiency market of $52
million is small in comparison with similar markets in Asia and Latin America, it is one of the best prospective
climate change-related markets on the African continent.
Energy Supply Sector. It is unlikely that South Africa will conduct significant fuel switching projects. The
Department of Minerals and Energy indicates that the country’s energy supply will continue to be based
largely on coal. There are abundant potential opportunities for clean coal technologies such as coal beneficiation, fluidized bed combustion, and integrated
gas combined cycle (IGCC). However, it is difficult to estimate even the baseline market for these technologies,
not to mention the additional climate change-related market, since the energy sector is predominantly state owned, and
the government’s energy and climate change programs are just in the initial stages of development.
Manufacturing Sector. South Africa’s primary metals processing (iron, steel, and aluminum) and petrochemical
industries represent the main opportunities for energy efficiency improvements in the manufacturing sector. The
increased competition resulting from the growing openness of South Africa’s economy, as well as increasing
energy prices, is likely to facilitate investments in industrial energy efficiency projects. Process improvements
and process controls are expected to dominate the manufacturing sector. The market for industrial process
control is estimated at $12 million a year (Hagler Bailly, 1997).
Commercial and Residential Sectors. South Africa is currently experiencing tremendous growth in its tourism
sector. The avalanche of foreign tourists (their number is increasing by an average of 15 percent a year) fuels a
hotel development boom. This, in turn, creates a market for energy-efficient building envelope technologies (an
estimated annual market of $16 million), energy-efficient air conditioners ($10 million), and, to a lesser extent,
energy-efficient lighting (Hagler Bailly, 1997). These are baseline market estimates, however, and in the absence
of relevant climate change mitigation programs, they may not translate into any additional market opportunities.
South Africa’s residential sector contributes just a small fraction of the countries GHG emissions and does not
represent a significant climate change-related market.
Transportation Sector. South Africa has a well-developed transportation infrastructure, largely controlled
and operated by the government-owned Transnet corporation. However, the use of public transport has
been severely constrained by the past land use development and allocation policies, resulting in low housing
densities and the poor being located furthest from work locations and social facilities. This inequitable spatial
development is having a direct impact on South Africa’s transportation patterns and results in the inefficient
energy use. Therefore, there is a potential market for transportation management consulting services.
There are also potential opportunities in increasing the fuel diversity in the transportation sector, which currently
depends entirely on imported oil products. The government is considering pilot programs to promote the use of
natural gas, hydrogen, and electricity as vehicle fuels.
Best Prospects: South Africa
Energy Supply Sector: Clean coal technologies.
Manufacturing Sector: Process improvements and process controls in primary metals processing and petrochemical industries.
Commercial and Residential Sectors: Technologies for energy-efficient heating, ventilation, and air conditioning, and building envelope technologies (e.g., for the tourism sector).
Transportation Sector: Transportation management consulting services. |
Contact
Us
About ITA
ITA Site Map
Privacy Statement
U.S.Department
of Commerce International
Trade Administration