Environmental Technologies Industries
 |
Environmental Technologies Industries
 |
| Water and Wastewater Treatment Export Market Plan |
Chapter 4. Best Prospects in Water and Wastewater Treatment
|
 |
|
|
Chapter 4 - Best Prospects in Water and Wastewater Treatment
The countries that represent best prospects for U.S. exporters of water and wastewater equipment and services are determined by a number of factors, including, but not limited to, the:
- Overall size of the water and wastewater market in the country;
- Openness of that market to imports (partly reflected in the share of imports in the total market);
- Market’s growth rate; and
- Historic U.S. position in the market and the U.S. import market share.
This chapter contains market profiles of 12 countries that fit several of these criteria. The profiled countries are Australia, Brazil, China, Egypt, India, Japan, South Korea, Mexico, Saudi Arabia, Spain, Taiwan, and the United Kingdom, representing a mix of developed and developing countries.
Each of the country profiles provides general statistical data, a market overview, and discussions of the regulatory and institutional framework for the water sector, the status of privatization of the water supply and sewerage infrastructure, U.S. market share and competition, and market opportunities.
Brazil, China, India, Japan, South Korea, Mexico, Spain, Taiwan, and the United Kingdom all have water and wastewater markets that exceed $1 billion in size. Such emerging markets as China, India, South Korea, Taiwan, Mexico, and Brazil have enormous potential due to the extent of unmet water supply and sewerage needs. These countries’ growth rates usually exceed 10 percent per year. Japan, the United Kingdom, and Spain are mature markets with slower growth, but their sheer size and favorable business climate make them worth exporters’ consideration. Australia is another mature market of smaller size than Japan, the United Kingdom, and Spain, but it is a market that favors U.S. firms. Egypt and Saudi Arabia are niche markets for U.S. exporters. Egypt is an exclusively donor-driven market, where U.S. foreign aid gives a significant advantage to American companies. Saudi Arabia is a highly specialized market with a focus on desalination technology, where the U.S. also has a good strategic position.
Table 4.1 presents a summary of the estimates of the principal market indicators for the profiled countries.
Table 4.1 - Principal Water and Wastewater Market Characteristics in Selected Countries
Country | Total Market Size
(millions of dollars) | Annual Growth
(percent) | Percent of Total
Market from Imports | U.S. Import Market Share (percent) |
| Australia | 603 (1999) | 7 | 70 | 55 |
| Brazil | 1,700 (1998) | N/A | 20 | 35 |
| China | 5,336 (1999) | 25-35 | 35 | 12 |
| Egypt | 856 (1998) | 10 | 90 | 35 |
| India | 1,180 (2000) | 15 | 40 | 25 |
| Japan | 6,000 (1996) | 5-8 | N/A | N/A |
| S. Korea | 3,400 (2000) | N/A | 40 | 20 |
| Mexico | 2,390 (2000) | 10 | 80 | 70 |
| Saudi Arabia | 357 (1998) | 5 | 85 | 16 |
| Spain | 4,000 (1998) | N/A | N/A | N/A |
| Taiwan | 1,900 (1999) | N/A | 75 | 28 |
| United Kingdom | 4,000 (2000) | 4 | 55 | 25 |
N/A = not available
Sources: Various - see references in individual country profiles.
Table 4.2 presents data on the value of U.S. water and wastewater technology exports to 32 countries. These data represent exports of potable water treatment equipment, water and wastewater monitoring and analysis equipment, and wastewater management equipment. The countries that are profiled here are indicated in gray.
Table 4.2 - U.S. Exports of Key Categories of Water and Wastewater Equipment, 1999
(thousands of U.S. dollars)
Rank | Country | Potable Water Treatment | Monitoring and Analysis | Wastewater Management | Total |
| 1 | Mexico | 173,533 | 2,399,198 | 1,710,963 | 4,283,694 |
| 2 | Canada | 68,955 | 2,789,464 | 1,014,083 | 3,872,502 |
| 3 | Japan | 232,961 | 1,023,557 | 143,317 | 1,399,835 |
| 4 | United Kingdom | 78,869 | 664,966 | 119,326 | 863,161 |
| 5 | Germany | 78,946 | 633,498 | 92,968 | 805,412 |
| 6 | South Korea | 178,534 | 384,983 | 68,827 | 632,344 |
| 7 | Taiwan | 174,857 | 354,546 | 62,139 | 591,542 |
| 8 | Singapore | 141,393 | 317,748 | 33,108 | 492,249 |
| 9 | China (w/Hong Kong) | 38,284 | 337,081 | 92,386 | 467,751 |
| 10 | Netherlands | 94,100 | 332,198 | 30,681 | 456,979 |
| 11 | France | 9,174 | 320,599 | 115,835 | 445,608 |
| 12 | Italy | 40,966 | 245,110 | 4,773 | 290,849 |
| 13 | Belgium | 735 | 119,342 | 51,064 | 171,141 |
| 14 | Malaysia | 40,968 | 107,197 | 12,800 | 160,965 |
| 15 | Australia | 4,919 | 87,109 | 48,568 | 140,596 |
| 16 | Brazil | 4,727 | 92,290 | 15,809 | 112,826 |
| 17 | Israel | 46,572 | 55,127 | 5,244 | 106,943 |
| 18 | Philippines | 54,655 | 32,289 | 1,478 | 88,422 |
| 19 | Spain | 805 | 49,336 | 24,674 | 74,815 |
| 20 | Thailand | 0 | 64,228 | 4,094 | 68,322 |
| 21 | Aruba | 58,662 | 0 | 0 | 58,662 |
| 22 | Saudi Arabia | 559 | 25,188 | 31,827 | 57,574 |
| 23 | Russia | 0 | 23,102 | 24,617 | 47,629 |
| 24 | Ireland | 0 | 29,074 | 11,689 | 40,763 |
| 25 | Switzerland | 0 | 33,913 | 3,353 | 37,266 |
| 26 | Venezuela | 9,609 | 14,475 | 12,593 | 36,677 |
| 27 | United Arab Emirates | 151 | 23,260 | 3,954 | 27,365 |
| 28 | Sweden | 0 | 24,382 | 786 | 25,168 |
| 29 | India | 0 | 14,879 | 6,888 | 21,767 |
| 30 | Argentina | 2,961 | 10,986 | 5,944 | 19,891 |
| 31 | Dominican Republic | 173 | 11,691 | 1,645 | 13,509 |
| 32 | Egypt | 1,057 | 930 | 9,360 | 11,347 |
| 33 | Turkey | 448 | 4,922 | 5,197 | 10,567 |
| 34 | Colombia | 2,267 | 2,215 | 5,133 | 9,615 |
| 35 | Austria | 5,149 | 1,997 | 0 | 7,146 |
Source: U.S. International Trade Commission, Harmonized Tariff Schedule.
Australia
Population: 19 million (2000)
Urban population: 84 percent (2000)
GNP per capita: $20,640 (1999)
GDP average annual growth rate: 3.8 percent (1990–1998)
Water supply coverage (urban/rural): 100 percent/
100 percent (2000)
Sanitation coverage (urban/rural): 100 percent/
100 percent (2000)
Market Overview
The sewerage systems in most of Australia’s major cities are old and overloaded. Infiltration of rainwater and overflows of sewage are frequent problems. Large investments are needed to increase sewer capacity and improve their condition, as well as to improve the quality of treatment. In addition, municipalities are turning to the practice of recycling wastewater in order to alleviate the pollution load of the country’s rivers and coastal waters. Water supply problems in Australia are not as urgent as wastewater ones, with nearly all the population connected to centralized water supply, most of which is treated to some degree, if only by disinfection.
Water and wastewater treatment are the largest segments of environmental business in Australia, representing 67 percent of the total environmental market. The total market for water and wastewater equipment was estimated at $603 million in 1999, with 70 percent of the demand satisfied by imported equipment. Investment in water supply infrastructure was roughly $232 million in 1999, compared to $374 million for municipal wastewater treatment plants. The distribution of these investments by state and territory is shown in Table 4.3. The market is growing at about 7 percent a year, due mainly to the water and sewerage infrastructure rehabilitation and expansion programs.
The industrial wastewater treatment market is much smaller but has been growing recently as the regulatory requirements for pretreating industrial effluents become more stringent. The Australian Water and Wastewater Association estimates that the Australian industry spends about $59 million per year for on-site effluent pretreatment.
Table 4.3 Investment in Water and Wastewater Treatment Plants in Australia, 1999
(millions of U.S. dollars)
State/Territory | Investment Amount |
| New South Wales | 203.4 |
| Victoria | 155.5 |
| Queensland | 93.5 |
| South Australia | 56.2 |
| Western Australia | 67.8 |
| Tasmania | 10.6 |
| Australian Capital Territory | 18.5 |
| Northern Territory | 0.7 |
| Total | 606.2 |
Source: The Water and Wastewater Market in Australia, Canada, Department of Foreign Affairs and International Trade (Ottawa, 1999).
Regulatory and Institutional Framework
Australia’s federal government has limited environmental responsibilities, with most functions administered by states and territories. The Department of Primary Industries and Energy oversees water resource issues. The National Environment Protection Council and the Environmental Protection Agency are responsible for coordinating environmental management programs at the federal and state levels. The Council oversees the implementation of environmental regulations at the federal level. However, pollution licenses are issued and enforced by state authorities. In some states (for example, Queensland), the licensing and enforcement have been delegated to the local councils. States have recently undertaken initiatives aimed at using guidelines and codes of practice for certain polluting industries, as part of the general trend away from a rigid command and- control system toward industrial self-monitoring and self-regulation.
State governments are responsible for water supply and wastewater treatment in Australia, although day-to-day operational management is carried out at the local level.
Privatization
Australian state governments are starting the process of restructuring and reforming public utilities by setting up state-owned corporations. The move is supposed to promote greater efficiency through increased competition. To date, almost all Australian public water authorities have been incorporated, and most states are looking toward eventual privatization, primarily due to the lack of investment funds. Presently, although state-owned utilities are still the main purchasers of wastewater treatment equipment, some of them have already been opened to private participation via management contracts. New sewage treatment plants are usually privatized under BOO contracts.
Trade and Investment Policy
No trade restrictions or other non-tariff barriers exist for imported water and wastewater equipment. The general import tariff rate varies from 0 to 5 percent, depending on whether or not local manufacturers exist for the same product. Certain state-of-the-art capital equipment may be imported duty free for specific projects.
There are no tight controls that govern imported water and wastewater equipment. Each technology or type of equipment is evaluated on its own merits. Details of applicable state-level technology requirements may be obtained from the environmental departments or relevant industry associations.
U.S. Market Share and Competition
Australia has developed world-class expertise in some areas of wastewater treatment, and a number of local environmental firms sell competitive sewage treatment process equipment. The majority of pipes and fittings are also manufactured locally. The industry is dominated by small and medium-sized companies with sales less than $1 million. The principal Australian manufacturers in this market include Acron Noble Pty. Ltd. (biological wastewater treatment systems), Australian Ultraviolet Services (ultraviolet disinfection equipment), Sepa Wastewater Treatment (turnkey treatment plants), Tubemakers of Australia (pipes and fittings), Warman International Ltd. (pumps), etc.
Domestic sales, however, have historically been hampered by the unwillingness of the water utilities to trust the local industry or to support local innovations. In addition, the local industry sometimes lacks investment capital to fund research and development projects and to commercialize their products.
The United States dominates the import market for wastewater treatment equipment with a 55 percent market share, followed by Germany, Britain, and Japan (see Figure 4.1). Wastewater equipment is also imported from France, Sweden, and Italy. The major overseas players include French companies ONDEO and Vivendi and the British company Thames Water. ONDEO is basing its Asia/Pacific wastewater research program in Sydney, creating a great potential for future exports. The success of these firms can be partly attributed to Australia’s historical choice of European over U.S.-designed sewerage systems. Another obstacle for U.S. suppliers is their reluctance to meet Australian quality assurance standards.
Many large wastewater treatment BOO projects have been awarded recently to French and British companies in consortia with Australian firms. A consortium led by Vivendi that includes Thames Water has recently won a $1 billion 15-year operations and management contract for Adelaide’s water and wastewater utility. U.S. companies have been largely absent from these projects. Nonetheless, U.S. water and wastewater equipment suppliers still have opportunities to sell to local companies bidding on such concessions.
Figure 4.1 Import Market Shares for Wastewater Treatment Equipment in Australia
Source: U.S. and Foreign Commercial Service and U.S. Department of State, Industry Sector Analysis; Australia: Wastewater Treatment Equipment (Washington, D.C.: 1998).
Market Opportunities
The biggest opportunities exist in wastewater treatment systems. Some of the major projects currently underway include:
- Upgrade of the Woodman Point wastewater treatment plant in Western Australia ($79 million)
- Expansion of the Perth sewerage network, Western Australia ($174 million)
- Construction of a sewerage tunnel and a sludge handling plant in Camellia, New South Wales ($178 million)
- The Hunter Sewerage Project, New South Wales ($205 million)
- Upgrade of the wastewater treatment plant at Cronulla, New South Wales ($60 million)
- Expansion of the Picton sewerage network, New South Wales ($36 million)
- The Northwestern Sewerage Project, Victoria ($152 million)
- Upgrade of the Bolivar wastewater treatment plant, South Australia ($66 million)
The largest water supply infrastructure projects are the upgrade of 30 inland water treatment plants in New South Wales ($180 million), 10 water treatment plants in South Australia ($54 million), and the Gladstone water supply expansion project in Queensland ($114 million).
Best sales prospects include biofiltration systems, sludge presses and stabilizers, oxidation systems for industrial wastewater treatment, filtration equipment, and membrane technologies for water recycling. Given the strength of local manufacturers, fewer opportunities exist for pumping equipment.
Some industrial wastewater treatment opportunities exist at gold and copper mines, wool scour mills, steel mills, pulp and paper mills, breweries, petrochemical plants, chemical and pharmaceutical plants, abattoirs, and food processing facilities.
Brazil
Population: 170 million (2000)
Urban population: 81 percent (2000)
GNP per capita: $4,420 (1999)
GDP average annual growth rate: 3.2 percent (1990–1998)
Water supply coverage (urban/rural): 95 percent/
45 percent (2000)
Sanitation coverage (urban/rural): 85 percent/
45 percent (2000)
Market Overview
Brazil’s water supply and sanitation sector is experiencing a wide range of technical, operational, financial, and other problems. The water supply network is expanding slowly and cannot cope with the rapid population growth. Up to 50 percent of water loss occurs in the distribution system. Municipal wastewater treatment has historically received even less investment than water supply. Only 20 percent of the wastewater collected is treated. Large quantities of untreated sewage are discharged into open waters, resulting in a serious public health hazard, particularly in such states as S�o Paulo, Minas Gerais, and Rio de Janeiro. There are also stark differences in the extent and quality of water supply and sanitation services between the richer south and southeast regions of the country (about 60 percent sewerage coverage) and the poorer north and northeast (less than 5 percent coverage).
In metropolitan centers such as Rio de Janeiro and S�o Paulo, industrial effluents represent around 30 percent of the organic load in the total wastewater discharges. About 20 percent of the industrial facilities are responsible for almost 80 percent of the industrial effluent load. Almost all the large polluters have signed agreements with regulatory agencies that defined their compliance plans.
Investment needs are estimated at $33 billion through 2010 to overcome existing gaps in water supply and sewerage coverage, as well as to respond to the growing demand for these services. The water and wastewater technologies market was estimated at $1.7 billion in 1998. The demand for consulting services will likely be around $100 million per year through 2004.
Regulatory and Institutional Framework
The 1997 Water Law introduced the river basin management approach in Brazil, with multi-stakeholder water basin committees being responsible for long-term water resources planning and charging water use and wastewater discharge fees (established in a 2000 regulation). The federal agency responsible for the regulation and overall supervision of the water resources sector is the Division of Sanitation of the Secretariat of Urban Policy of the Ministry of Planning and Budget. The policy stipulates that water supply and sanitation services can be provided by state-wide water and wastewater companies (under current concessions), municipal public utilities, or private companies. In 2000, a new law created the National Water Agency, which will coordinate the national water policy and the privatization of state-owned water companies.
The 1990 National Environmental Policy Act defined water quality standards and a national discharge permit system that are based on nine water use categories (for example, domestic consumption, recreation, irrigation, etc.). The permit system is administered by the National Environmental Council. States have the authority to make their regulations more stringent than the federal standards. For example, the environmental agencies in the states of Rio de Janeiro and S�o Paulo have adopted effluent standards that require secondary treatment of wastewater discharges. Recent regulations require effluent self-monitoring and reporting from municipal sewage treatment plants and several types of industry. The 1998 Environmental Law contributed significantly to the improvement of environmental enforcement in the country by raising sanctions for environmental violations.
Privatization
In the 1990s, privatization of state-owned enterprises began to be recognized as a tool for economic change, as the government strove to reduce subsidies to unprofitable companies. Public service monopolies started to open up to competition and impartial regulation. Ambitious privatization programs have been undertaken in the telecommunications, power, and, to a lesser extent, water and sanitation sectors.
According to the Law on Concessions, the authority to issue water and wastewater concessions rests at the municipal level. However, the state authorities continue to oversee regional distribution networks and utilities that service more than one municipality. In fact, state governments are better positioned than municipalities to design concessions and provide financing guarantees for projects.
Resources are available through the Brazilian Economic Development Bank to finance privatization studies and projects, both at the state and municipal levels. The Bank is more inclined to support post-privatization investments by operators than finance the privatization process itself.
The private sector participation models currently used in Brazil’s water sector include service contracts (most commonly used), full concessions (used mostly in smaller cities), BOT schemes (in the states of S�o Paulo and Minas Gerais), and joint ownership arrangements (so far, the only example of this scheme is the Parana State Water Company).
The majority of private participation projects (16) are taking place in the state of S�o Paulo, most under the BOT scheme, with six of them involving investments of over $10 million. The largest project in the state is the $124 million concession that has been granted to Aguas de Limeira, a joint venture between the French conglomerate ONDEO and Compahnia Brasiliera de Projectos e Obras, a Brazilian civil construction firm. The state of Rio de Janeiro uses only the full concession model, and the four largest mixed water/wastewater concessions in the state are worth almost $400 million in investments. Another breakthrough for the private sector occurred in 1998, when Vivendi acquired 30 percent of the shares of Sanepar, which serves seven million people in the state of Parana.
At the same time, water utility privatization faces opposition from some political groups and unions. For example, the privatization of CEDAE (the Rio de Janeiro state public company), the second-largest water company in Brazil, has been canceled due to political controversy and legal actions.
Trade and Investment Policy
Brazil is a member of Mercosur - a regional free trade agreement that also includes Argentina, Paraguay, and Uruguay. However, Brazil’s industry remains protected from imports from non-Mercosur countries. Tariffs for environmental equipment are still high (even though they have dropped dramatically over the last decade) and average 19 percent.
Despite the fact that Brazil must comply with World Trade Organization (WTO) regulations requiring equal treatment of foreign and domestic companies, there is a nonofficial “buy Brazilian” policy for government procurement. Foreign companies that have production facilities in Brazil are usually chosen over those that have not committed to investment in the country. Brazilian law requires foreign bidders to be associated with a local firm.
U.S. Market Share and Competition
Over 80 percent of the water supply and sanitation equipment in Brazil is produced by Brazilian manufacturers, although roughly half of them are engaged in some form of technology agreement with foreign partners. For instance, the market for pipes and fittings is dominated by the French company Pont-�-Mousson, which operates under the name Barbara in Brazil. Filsan and its subsidiaries, Enfil and Aquamec, are other examples of Brazilian water and wastewater equipment suppliers having a significant market share. These companies have operated for over 30 years and have established solid relationships with most municipal and state clients. Partnering with a Brazilian company is almost imperative for foreign exporters in this market.
U.S. exports represent about 35 percent of the import market for municipal water supply and wastewater treatment equipment, followed by France, Germany, and Sweden. In the industrial wastewater treatment market segment, the U.S. holds a 60 percent import market share, followed by France and Japan (see Figure 4.2). The best established European water companies in Brazil are the French groups Vivendi and ONDEO, Britain’s Thames Water, and Aguas de Portugal.
Figure 4.2 Import Market Shares for Industrial Wastewater Treatment Equipment in Brazil
Source: Canada, Department of Foreign Affairs and International Trade, The Water and Wastewater Market in Brazil (Ottawa, 1999).
Market Opportunities
All around Brazil, significant potential opportunities abound for investors and suppliers of water and wastewater equipment and services to participate in the privatization program. A strong market growth can be expected for BOT projects in the construction and operation of wastewater treatment plants, particularly in cities with over 100,000 inhabitants.
About 80 percent of the funds allocated for improvements of water and wastewater systems in low-income areas is distributed through Brazil’s Social Action and Sanitation Program. Between 1995 and 1998, the program spent $440 million on water supply improvements and $930 million on wastewater treatment projects.
Other opportunities come from large projects implemented with support from multilateral development banks, including the IDB’s Tiete River Cleanup Project ($400 million), the Federal District Basic Sanitation Program ($260 million), the Guaiba Watershed Environmental Management Program ($221 million), as well as the World Bank’s Bahia Water Resources Management project ($51 million), and S�o Paulo Water Quality and Pollution Control Program ($245 million).
Private industry, particularly textile, petrochemical, and pulp and paper industries, pressured by stricter environmental laws, will also invest more in effluent treatment equipment.
Wastewater treatment accounted for 41 percent of investments in this sector in 2000, water infrastructure improvements for 38 percent, sewerage system upgrades for 15 percent, and engineering and consulting services for 6 percent. Table 4.4 presents projected opportunities for sales of different types of wastewater equipment. Despite the strength of local manufacturers of pipes, valves, pumps, and septic tanks, there are still technology gaps in Brazil’s water and wastewater market that need to be filled by imports. These include hydrometers, leak detection equipment, and wastewater treatment equipment and chemicals, as well as automation software.
Table 4.4 Brazilian Wastewater Equipment Demand Forecast, 2001–2004 (millions of U.S. dollars)
Equipment Type | 2001 | 2002 | 2003 | 2004 |
| Wastewater treatment equipment | 200 | 270 | 350 | 450 |
| Pipes | 450 | 500 | 520 | 550 |
| Hydrometers | 98 | 123 | 131 | 135 |
| Pipe cleaning equipment | 15 | 17 | 21 | 23 |
| Valves | 15 | 20 | 26 | 33 |
| Pumps | 45 | 52 | 58 | 67 |
| Other | 32 | 38 | 44 | 52 |
| Total | 855 | 1,020 | 1,050 | 1,310 |
Source: Brazilian Wastewater Industry Forecast 2000, InfoAmericas (http://infoamericas.com).
People’s Republic of China
Population: 1.278 billion (2000)
Urban population: 32 percent (2000)
GNP per capita: $780 (1999)
GDP average annual growth rate: 11.2 percent (1990–1998)
Water supply coverage (urban/rural): 94 percent/66 percent (2000)
Sanitation coverage (urban/rural): 68 percent/24 percent (2000)
This market profile covers both mainland China and Hong Kong. On July 1, 1997, Hong Kong reverted to Chinese sovereignty under the concept of “one country, two systems” and, as a Special Administrative Region, is run with a high degree of autonomy.
Market Overview
Water supply and wastewater treatment are presently top priorities of China’s environmental protection and infrastructure development policies. Water shortages, caused by uneven distribution, inefficient use, and contamination of water resources, affect approximately 400 cities in China. Thirty cities, including Beijing, are expected to face long-term water shortages.
Ambient water quality has deteriorated dramatically due to the phenomenal growth in industrial development over the last two decades, lack of enforcement of environmental standards, poor treatment of industrial effluents, and inadequate investments in infrastructure. Presently, in urban areas, less than 20 percent of wastewater is treated, and close to 90 percent of urban drinking water sources are polluted to some degree. China has committed to continue its efforts to improve water supply and sanitation. The government has set a target of a 40 percent treatment rate for sewage by 2010. This will require approximately $24 to $36 billion, excluding operating costs.
In Hong Kong, water pollution from sewage and industrial wastewater discharges is the most visible environmental concern. Roughly 10 percent of wastewater receives biological treatment before discharge, 40 percent receives partial treatment, and the remaining 50 percent is discharged into the sea without any treatment.
Under China’s Ninth Five-Year Plan (1996-2000), the clean-up of three lakes (Tai, Chao, and Dianchi) and three rivers (Huai, Hai, and Liao) were top priorities of the state economic development policy. The clean-up effort achieved some positive results. However, the construction of 131 new municipal wastewater treatment plants has yet to begin, and 535 industrial plants have to install effluent treatment systems.
Table 4.5 Estimated Size of the Water and Wastewater Technologies Market in China, 1999
(millions of U.S. dollars)
| Local Production | Imports | Total Market Size | Growth Rate 2000-2001 |
| Water treatment and supply | 1,506 | 646 | 2,152 | 35% |
| Wastewater treatment | 1,911 | 1,273 | 3,184 | 25% |
| Total | 3,417 | 1,919 | 5,336 | |
Sources: China: “Water Treatment and Supply” and “China: Wastewater Treatment Technologies,” Industry Sector Analyses, U.S. and Foreign Commercial Service and U.S. Department of State, 1998.
China’s water and wastewater technologies market is enormous - over $5.3 billion in 1999. Even though most of the market demand is covered by local production, the import market alone amounts, according to the U.S. Commercial Service, to almost $2 billion a year.
The size of the market for water and wastewater technologies is enormous and the scope of the country’s water and wastewater projects is gargantuan. For example, the Chinese government has committed to a plan to transfer water to the parched north from the wet southern regions. In 2001, the PRC government has committed to a schedule to make this South-North Water Transfer project a reality. Three transfer channels will be constructed, the first two in the east and in the center. The eastern route will be completed by 2010 with a total cost of $7.25 billion. Phase I of the construction of the central route will be completed by 2010. The total cost of this effort will be approximately $10 billion. The western route is still in the early planning phases.The government has stressed that this project is to be linked with enhanced efforts to increase water use efficiency, prevent pollution, and charge appropriate water prices.
Regulatory and Institutional Framework
China’s State Environmental Protection Agency is responsible for drafting and interpreting national environmental laws and regulations. As part of the 1998 government reorganization, the agency was upgraded to full ministerial rank. Responsibility for enforcement rests with provincial and local Environmental Protection Bureaus. Responsibility for water management in China is divided among several ministries, including the Ministry of Water Resources and the Ministry of Construction. Water and wastewater utilities are run by municipalities under the direction of provincial and municipal Planning Commissions.
China is implementing a national “one control, two standards” policy, which requires provinces to set limits on the volume of discharges and meet industrial effluent standards.
In general, the responsibility and power of local authorities seems to be increasing. Key cities are required to meet water quality standards. The 1984 Clean Water Law was amended in 1996, requiring all cities with populations over 250,000 to build municipal wastewater treatment plants. The amendments also required industries to pay a “pollution discharge fee” for their effluents.
Although the environmental regulatory framework is comprehensive, enforcement remains a problem because laws established by the central agency are supposed to be enforced by local governments, which are often reluctant, for political, economic, and social reasons, to penalize industries within their jurisdiction. There is evidence, however, that this is changing. For example, late last year in the Huai River area, over 1,000 businesses were forced to close for noncompliance.
In 1997, the State Development and Planning Commission approved policies concerning water conservation. The policies defined the functions of the central and local governments in water resource management. Investment from the central government is earmarked for construction of large-scale, inter-provincial infrastructure projects. Inter-basin and local projects should be financed through local budgets and commercial channels.
One of the largest constraints to the development of the Chinese water and wastewater market is the lack of market pricing for water. High government subsidies for water have meant that water is supplied to consumers at a loss, resulting in a lack of return on investments in water projects for both local and foreign investors. In 1998, China’s State Council required a three-year timetable for water price market reform. As a result, the price of water for agricultural use will likely triple in the near future. Urban and industrial users will also face increases. Between 1996 and 1998 alone, the residential water rate in Beijing doubled to 1 RMB per ton. However, it is estimated that the true cost of water is actually 5 RMB per ton.
The State Development and Planning Commission addressed wastewater treatment pricing in its 1999 Notice on Increasing Wastewater Fees and Establishing an Urban Wastewater Treatment System. This rule states that wastewater treatment fees shall be based on operation and maintenance costs of wastewater treatment plants. Urban public utility bureaus will be responsible for collection. Prices have been increased subsequently.
Privatization
Growth rates in different industrial sectors continue to shift the composition of the economy from the public to the private sector. The government has made serious efforts to downsize the large state sector and many state owned enterprises have been sold or closed. However, the current policy of administrative price controls is at odds with the goal of achieving greater economic efficiency through market-oriented reforms. Recent contracts in water supply indicate that there are opportunities in BOT schemes (see the section on market opportunities). However, foreign exchange guarantees are not readily available and operators often bear all foreign currency risks. The State Development and Planning Commission stipulated that “the government will not provide a direct guarantee for the project return rate. Neither China’s state owned financial nor nonfinancial institutions are allowed to provide direct guarantee to the project contractor.” In 1998, the People’s Bank of China further tightened control over the guarantee issue in response to the Asian financial crisis.
The Hong Kong government is looking to privatize water treatment operations over the next five years. A feasibility study is currently underway to assess the different privatization models and evaluate which would be best suited for Hong Kong’s market conditions.
Trade and Investment Policy
China is currently negotiating entry into the WTO, which would recognize its role as a major trading nation. Membership would require China to revise and reduce most of its trade barriers. Presently, import tariff rates are divided into two categories: the general tariff and the minimum or Most Favored Nation tariff. Imports from the U.S. are assessed at the minimum tariff rate due to an agreement between the two countries that contains reciprocal preferential tariff clauses. There is a 14 to 30 percent duty on imports of environmental products, with the highest duties imposed on water filtering and purifying machinery. Five Special Economic Zones (Dalian, Tianjin, Shanghai, Guanzhou, and Hainan), open cities, and foreign trade zones offer preferential duty reduction or exemption.
A common problem faced by many U.S. firms that have entered the Chinese market is the inconsistent application of import regulations. In customs procedures, it is not uncommon for the same product to be subject to different levies in different ports, as they each add to the basic import tariff the local jurisdiction’s own administrative and miscellaneous fees. This creates uncertainty in the calculation of export costs and impedes the establishment of consistent, long-term commercial ties.
China also administers a complex system of non-tariff trade barriers that include import licensing, quotas, and administration controls such as import registration. The United States is putting considerable pressure on China to reduce tariffs, phase out non-tariff import restrictions, publicize all trade-related regulations, and grant unconditional national treatment to foreign investors as a prerequisite of its accession to the WTO.
China has opened a number of sensitive sectors to investment on an experimental and limited basis and has introduced new incentives for foreign investors designed to modernize Chinese industry. Most of the investment has been in the coastal regions of the five Special Economic Zones and now in the western portions of the country.
The government continues to pursue reforms in foreign exchange controls, taxation, foreign trade, and state enterprise restructuring that affect the foreign investment climate. In 1996, China announced full convertibility of its currency on the current account and instituted new, more liberal regulations allowing both domestic enterprises and those backed by foreign investment to freely convert currencies for current account transactions.
However, China’s restrictive foreign trade and investment regulations deny foreign companies national treatment in almost all industry and service sectors. There is also a general lack of transparency and inconsistent enforcement with regard to China’s legal and regulatory system, which leads to ambiguities and excessive bureaucratic influence. Although it is at the discretion of procuring government agencies to determine their own suppliers and forms of procurement, a number of project types must first get approval from the central government. These include public construction projects exceeding $9 million (which would include all water and wastewater infrastructure projects), and foreign enterprises or joint ventures that exceed $45 million. This approval process may take a long time.
In general, Chinese government procurement is highly centralized and is not known for being transparent. The U.S. State Department has noted that China’s procurement practices “have often not been consistent with open and competitive bidding and, for the most part, non-transparent. . . . All information, from solicitation to award, remains secret and is known only to companies involved or to officials in the planning and industrial ministries.” Tenders for projects funded by international organizations are usually openly announced, whereas most Chinese “government procurement is by invitation only.” This scheme is supposed to change under new regulations issued by the Chinese State Development Planning Commission in 1999.
Foreign companies are currently not allowed to engage directly in distributing imported goods in mainland China, although this will change once China joins the WTO. Presently, foreign suppliers must either distribute their products through a Chinese agent, form a joint venture with a Chinese firm, or manufacture the goods locally. Each region has its individual distribution requirements, so hiring multiple agents is essential. Hong Kong is a free port and does not impose any customs tariff on imports, has no tariff quota or surcharge, and no value-added or general services taxes. Public sector procurement in Hong Kong complies with the WTO’s Agreement on Government Procurement.
U.S. Market Share and Competition
There are currently about 32,000 water equipment manufacturing companies in China and that number is increasing. Although most of these companies produce low-quality, unsophisticated technologies, domestic production should not be underestimated. Domestic suppliers now handle approximately two-thirds of the market. One of the largest environmental firms in Beijing currently supplies 50 percent of the wastewater market in the city, while its branch office in Shenzhen covers 90 percent of the market there. Domestic production will continue to increase for a number of reasons. One of them is China’s desire to become self-sufficient in the area of environmental technologies. Another is that small enterprises are moving into the market because of the opportunities presented by increased government funding.
In 1997, the U.S. had the third-largest import share in both the water supply and wastewater treatment markets (at 11 percent and 12 percent, respectively), after Japan and Germany (see Figure 4.3). The U.S. wastewater technology industry already has a strong presence in the filter technology market, supplying over 60 percent of wastewater filters in China. However, it is critical to remember that competition is fierce.
Figure 4.3 Import Market Shares for Water and Wastewater Technologies in China
Water Supply
Wastewater Treatment
Source: Canada, Department of Foreign Affairs and International Trade, The Environmental Market in China (Ottawa, 2001).
Cost is the primary inhibitor for importing U.S. water and wastewater technology into China. While U.S. technologies are acknowledged to be of superb quality, Chinese buyers are often more concerned with financing and price. Grants from foreign governments strongly affect Chinese end users’ purchasing decisions. Japan and many European governments often provide low-interest soft loans with extended repayment terms to help finance their countries’ technology exports, giving them a major advantage over U.S. firms.
U.S. competitors are very active in China’s emerging BOT market. The 18-year concession in Chengdu (Sichuan Province) was awarded in 1998 to the consortium of Vivendi (France) and Marubeni Company (Japan).
In 1997, ONDEO was awarded a 30-year BOT contract for a 450,000 m3/day drinking water treatment plant in Shenyang, the capital of Liaoning Province. ONDEO also got a similar contract for a 500,000 m3/day drinking water treatment plant in Guangzhou (Guangdong Province), and smaller contracts in Gaozhou (Guangdong Province) and Nachang (Jiangxi Province). Another BOT concession (for 22.5 years) was awarded to a consortium of British companies, Bovis Construction Group and Thames Water, to build a $73 million water treatment plant in a district of Shanghai.
The first joint project between a U.S. company and a Chinese partner for the development of a municipal wastewater treatment plant was signed in 1999 between Lemna International and the Guangzhou Tunnel Development Authority. The project is estimated at $120 million. U.S. firms will supply $18 million worth of equipment exports and $2 million worth of environmental services. As the Guangzhou Municipality is looking to undertake 10 similar projects over the next few years, the signing of a U.S. firm for the first project creates a good precedent for other U.S. companies.
The notion of guanxi (relationships) is very important to any kind of venture in China. U.S. companies must be willing to develop close relationships with their Chinese partners, as well as local governments. Good personal relationships are often the most critical success factor.
Market Opportunities
Responding to the country’s serious water resource problems, the World Bank and the Asian Development Bank have dramatically increased their funding in China on water infrastructure projects, creating significant commercial opportunities for U.S. firms. In the past, projects funded by multilateral development banks presented opportunities for foreign companies in Eastern China. As the Chinese government has shifted its focus to promoting development of the western provinces, so have the World Bank and the Asian Development Bank. An estimated $1.26 billion worth of water supply and wastewater management projects are currently underway or in preparation. (As noted above, large projects funded by international organizations are often more transparent than those funded solely by the Chinese government.)
The following are just some of the water and wastewater projects in China funded through World Bank or Asian Development Bank loans (see Appendix A for more details on these and other ongoing and forthcoming multilateral development bank projects):
- Beijing Environmental Protection Project (World Bank). Among the goals of the second phase of this project is to improve the city’s sewage collection and treatment system.
- Shandong Environment Project (World Bank). The project focuses on wastewater management and efficient use of water resources in the city of Jinan, Shandong province.
- Hubei Urban Environmental Project (World Bank). The goal of this $223 million project is to improve water quality in the urban areas of the mid-Yangtze River basin by constructing interseptor sewer systems and wastewater treatment facilities.
- Chongqing Industrial Reform and Pollution Control Program (World Bank). This long-term program for water resource management includes construction of wastewater treatment plants as well as upgrading water supply and distribution systems.
- Liao River Basin Project (World Bank). The investment component of this river basin pollution cleanup project is expected to include water supply and wastewater management.
- Huai River Basin Pollution Control Project (World Bank). The project will help local governments in the Anhui and Shandong provinces develop and finance municipal pollution control investments.
- Tianjin Wastewater Treatment and Water Resource Protection Project (Asian Development Bank). The $300 million project includes the construction of Beicang wastewater treatment facilities and implementation of a water resource protection scheme for the Luan-Tianjin diversion system.
- Suzhou Creek Rehabilitation Program (Asian Development Bank). The $445 million effort includes improving sewage treatment systems, treating contaminated sediments, and introducing water resource management and quality control methods.
- Hai and Luan Wastewater Program (Asian Development Bank). The objective of this $900 million program is to improve water quality in one of three river basins on the Chinese government’s priority list.
Public authorities continue to be the main end-users of water and wastewater technologies and services in China. As domestic Chinese firms are strong in small-scale wastewater treatment technology projects, the best market for U.S. water and wastewater treatment equipment is in large and medium-sized municipal facilities. The greatest demand is for low-cost but highly efficient systems, including aerators, pumps, valves, sludge scrapers and mixers, disinfecting equipment and chemical agent production equipment, water quality monitoring and automatic control systems, dewatering machines, and various kinds of pipes.
In the industrial wastewater treatment market, the best opportunities exist in the pharmaceutical, food processing, fish farming, paper, textile, paint, chemical, and fertilizer industries. These industry sectors are the main targets of the “three lakes, three rivers” government program. There are also opportunities with large multinational companies working in China, many of which are complying with higher, worldwide corporate environmental standards.
In addition, there is an expanding market for smaller water and wastewater facilities in rural areas. For example, Phase II of the Chongqing Urban Environmental Management Project includes an emphasis on provision of infrastructure to rural communities.
Some of the better equipment sales prospects in China are water monitoring instruments, drinking water purification systems, industrial wastewater treatment equipment, and resource recovery technologies.
The Hong Kong government has designed a Strategic Sewage Disposal Scheme, an ambitious plan to link major urban developments around Victoria Harbor to new sewage treatment facilities. The various options for ultimate disposal of sewage from the metropolitan area are currently being reviewed. The project’s total cost is estimated at $5.2 billion.
While Hong Kong by itself represents a strong market for wastewater equipment, it is also a gateway to the enormous mainland China market. Hong Kong remains China’s largest port and the entry point for most of China’s imports, particularly goods exported by small and medium-sized enterprises.
U.S. water and wastewater equipment and technology are seen as being high quality and cutting edge. However, it is also often more expensive than competitors’ equipment and technology. The best sales prospects are in the areas of water monitoring equipment, home water filtration systems, and turnkey solutions to large-scale water treatment problems.
Egypt
Population: 68 million (2000)
Urban population: 45 percent (2000)
GNP per capita: $1,400 (1999)
GDP average annual growth rate: 4.2 percent (1990-1998)
Water supply coverage (urban/rural): 96 percent/94 percent (2000)
Sanitation coverage (urban/rural): 98 percent/91 percent (2000)
Market Overview
The Nile is the source for more than 95 percent of Egypt’s water, supplying a large population, a burgeoning industrial base, and over seven million acres of highly productive irrigated lands. The Nile is also the ultimate recipient of Egypt’s wastewater. A rapidly expanding population and the disposal of untreated wastes are putting increased demands on the country’s water supply.
Only large cities such as Cairo and Alexandria provide treated drinking water to all of their residents. Existing surface water filtration plants use conventional water treatment plant processes consisting of pre-chlorination, aluminum sulfate coagulation/flocculation, sedimentation, rapid sand filtration, and post-chlorination. The municipal water supply is often unreliable, particularly in rural areas. The distribution system cannot satisfy peak demands, and, in some cases, water has to be rationed.
Approximately 40 of 60 Egyptian cities have sewerage systems connected to existing (or under construction) primary or secondary treatment plants, which provides 70 percent of the urban population with access to some kind of sanitation services. However, 85 percent of the total load of municipal sewage receives little or no treatment. In rural areas, the overwhelming majority of the population does not have access to either sewer systems or treatment facilities. The rural population uses on-site disposal systems—leaching pits, septic tanks adjacent to houses, or direct discharges of raw sewage to drains and canals. The disposal of untreated sewage creates a threat to public health and the environment.
Industrial wastewater discharges are considered one of the major sources of water pollution in Egypt. The major wastewater dischargers in Greater Cairo are metallurgical, sugar, and chemical industries. Large sources of effluents in Alexandria are the pulp and paper, chemical, metallurgical, and textile industries. Industrial wastewater is either discharged directly into the waterways (for example, in the cities of Suez, Port Said, Ismailia) or through municipal systems which discharge into the Nile and its canals. Over 80 percent of industrial discharges do not receive any treatment. Industrial wastewater dumped into public sewers without pretreatment causes damage to sewerage systems through corrosion or by inhibiting biological processes.
In 1998, the total market for water and wastewater technologies in Egypt was $856 million and growing at an average rate of 10 percent a year. Imports comprised over 90 percent of the market.
Regulatory and Institutional Framework
Wastewater discharges in Egypt are regulated by Law 93 of 1962 (and its Executive Regulations, Decree 649 of 1962) and Law 48 of 1982 (and its Executive Regulations, Decree 8 of 1983). Law 48 prohibits the discharge of untreated wastewater into groundwater and surface waters used as sources of potable water. Discharges of treated wastewater into a waterway require a license from the Ministry of Public Works and Water Resources. Decree 8/1983 contains discharge standards for treated industrial and municipal wastewater to be discharged into potable and non-potable surface waters and groundwater.
Industries in Egypt are required to discharge their wastewater into public sewers, except when they are located outside the coverage area. Decree 649 lists the types of industrial establishments that need licenses to discharge wastewater into public sewers and the standards they must adhere to.
At the national level, Law 4 of 1994 designates the Egyptian Environmental Affairs Agency (EEAA) as the overall national environmental coordination and supervision authority. In addition to the EEAA, many sectoral ministries exercise environmental management responsibilities. The responsibilities of the relevant government agencies in the water sector are summarized below:
- The EEAA coordinates with the appropriate authorities to issue and enforce licenses for projects in the coastal zone.
- The Ministry of Health sets drinking water standards, industrial and municipal discharge standards and monitors the quality of drinking water sources and drinking water quality.
- The Ministry of Housing, Utilities, and New Communities (MHUNC) designs and constructs water supply and treatment systems, sewerage and sewage treatment facilities, issues and enforces licenses for discharges to public sewers, and enforces relevant discharge standards.
- The Ministry of Public Works and Water Resources (MPWWR) issues and enforces licenses for discharges to surface waters and groundwater, enforces relevant discharge standards, and monitors ambient water quality.
- The Ministry of Interior’s Water Police Force controls pollution of inland waters and coastal areas.
Enforcement of environmental regulations has been poor and inconsistent. Enforcement responsibilities are generally divided between the EEAA and the sectoral ministries. The level of enforcement depends on the power of responsible authorities and the willingness of officials in the governorates (provinces) and municipal governments to cooperate with these enforcers.
High rates of unemployment make the government a reluctant enforcer where enterprise shut-down is widely, though mistakenly, understood as the only enforcement option available. Furthermore, the fact that the EEAA is not the only enforcement agency complicates enforcement efforts. Since the regulations have been enacted, the Egyptian government realizes that enforcement is costly and technically complex. The government intends, therefore, to focus first on major polluters and assist them in moving toward compliance, while developing a long-term monitoring and enforcement program.
Overall, Egypt’s environmental regulatory and institutional framework suffers from:
- the lack of effective operational strategies;
- redundancies and fragmentation of responsibilities between the EEAA, sectoral ministries, governorates, and municipal authorities;
- weak monitoring capacity at the national and local level; and
- limited technical, management, and enforcement capabilities to address the major environmental issues of the country.
Privatization
In the 1990s, the Egyptian government launched a comprehensive Economic Reform and Structural Adjustment Program supported by the International Monetary Fund (IMF), the World Bank, and other international donors. As part of its reform program, the government is focusing on liberalizing its trade regime, encouraging private sector growth, and improving the investment climate.
In 1996, the Egyptian government began to make progress toward selling off state-owned companies. It is considering offering concessions for water and wastewater utilities. For example, as part of its five-year plan (1998-2002), the government is planning to upgrade 150 facilities so that they can be transferred to the private sector, as well as construct 12 new facilities for the new industrial cities through BOT arrangements.
Trade and Investment Policy
One of the key areas of Egypt’s economic policy reform has been trade liberalization. In 1995, Egypt joined the WTO. Egypt and the United States agreed in May 1998 to begin talks on a Trade and Investment Framework Agreement (TIFA). The TIFA is expected to be an intermediary step before starting talks on a free trade area agreement at some future date. Egypt has been in negotiations with the European Union on an association agreement under the Mediterranean initiative since 1995. New import and export regulations adopted in January 1998 reduced import duties and eliminated some non-tariff trade barriers. However, Egypt has yet to change many of its protectionist policies.
The 1997 investment law reaffirms basic guarantees for investors and clarifies the framework for investment incentives. In an effort to improve coordination between the central government and the localities on investment issues, Egypt has also established investment offices in the governorates.
However, Egypt has yet to reduce trade barriers and eliminate unnecessary regulations and restrictions on business activities. Law 228/1997 reduces import duties on finished goods that have at least 30 percent local content, from an average of 50 percent to 45 percent. These reductions are part of the IMF-approved economic liberalization program and are meant to encourage investments in local manufacturing. In addition to the import duty, a sales tax ranging from 5 percent to 25 percent is added to the final customs value of the imported item. The current tariff policies and structures do not give special treatment to environmental equipment.
The domestic industry also remains protected by many non-tariff import barriers, including service fees and the mandatory product inspection list. In addition, administrative procedures regarding customs clearances appear to be causing unnecessary delays to bringing environmental equipment into the country. Egyptian customs authorities do not have to justify their decisions, and there is no formal appeals process. The customs procedures are subjective in determining whether a commodity fits in one tariff category or another, and experience has shown that the same commodity may be classified differently and consequently be subject to different tariff rates under different shipments.
In FY 1999, the U.S. Congress reduced the amount of aid under the Egypt Economic Support Fund, with the objective of moving the U.S.-Egypt partnership from an aid-based relationship to more mature cooperation based on trade. Nonetheless, Egypt remains the world’s largest recipient of U.S. foreign assistance, with $695 million worth of aid expected in FY 2001.
U.S. Market Share and Competition
U.S. companies have a lead in Egypt’s water and wastewater sector, mostly due to the large USAID procurements. The U.S. market share was about 35 percent in 1998.75 French firms are the main competitors of U.S. suppliers of water supply equipment, while British companies have a high profile in the municipal wastewater treatment market. German and Italian firms are also active in this market.
Market Opportunities
USAID/Egypt operates the largest environmental program of all USAID missions. The United States is also by far the biggest donor for environmental initiatives in Egypt.
Egypt’s water and wastewater sector represents enormous opportunities for U.S. equipment suppliers, mostly through direct USAID procurement. USAID’s water/wastewater program also supports the commercialization of water and wastewater management through private sector participation, including greater autonomy for utilities in planning, construction, and financial management, as well as an improved regulatory climate for private investment in the sector.
Over the past 20 years, USAID has invested approximately $2.6 billion in Egypt’s water and wastewater infrastructure. The following are USAID/Egypt’s largest ongoing projects in this sector, all of which involve extensive procurement of U.S. equipment.
Under the Secondary Cities Development project (1994–2002, $215 million), USAID is expanding water and wastewater infrastructure investments to reach the communities of Mansoura, Nuweiba, Luxor, and the Aswan group of Nasr City, Kom Ombo, and Darawo City. Water and wastewater treatment works include collection/distribution pipeline networks, pumping stations, and storage tanks.
Working with the General Organization for Sanitary Drainage of Alexandria, USAID has invested $425 million in the design, construction, and start-up of a sewerage system for approximately 75 percent of the city since 1978. The current Alexandria Wastewater System Expansion II program (1998–2002, $90 million) will double the capacity of two treatment plants, upgrade the pumping stations, and improve the sludge disposal systems to accommodate the projected population growth. The Alexandria Drinking Water initiative (1998–2002, $200 million) will assist the Alexandria Water General Authority in implementing its water supply and distribution systems master plan.
The three newly formed Economic General Authorities for Water Supply and Sanitary Drainage in the governorates (provinces) of Fayoum, Beni Suef, and Minya are the partners in the Egypt Utilities Management program (1997–2004, $215 million) to provide water and wastewater services for their residents.
It should be noted that USAID’s assistance in Egypt is gradually moving away from infrastructure construction and technology demonstration in the water sector toward greater policy assistance to manage the systems created through past capital investments.
Installation of new sewer and potable water systems, and rehabilitation of old water infrastructure are also major national government priorities in the 1998-2002 five-year plan. The projects tentatively approved by the Egyptian government include:
- Upgrading 1,000 existing compact water treatment units.
- Constructing 500 new units of 2,000–5,000 m3/day capacity.
- Upgrading 26 existing water treatment facilities, including major rehabilitation and repairs.
- Installation of 400–600 wastewater treatment units in rural areas (500–2,000 m3/day).
The World Bank has recently launched a Middle East and North Africa Water Partnership program that is designed to energize and harmonize government and donor efforts in the water and wastewater sector. Ultimately, it will increase overall investment in this sector by 200 to 300 percent. The program will facilitate investment from government, donor, and private sector sources for rehabilitation and expansion of water distribution and transfer networks; expansion of wastewater collection and treatment systems; and protection of water quality.
There are opportunities in the municipal wastewater market for foreign companies in environmental engineering and design of new treatment systems, sales of equipment for pump stations and wastewater treatment plants, and, possibly, operation and maintenance contracts for secondary treatment facilities. For joint ventures between foreign and local companies, there are opportunities to construct/expand new sewerage systems, to manufacture and sell components for compact wastewater treatment facilities, and to manufacture and sell PVC pipes and valves. There may also be opportunities for the operation and maintenance of existing water and wastewater facilities.
In the water supply and treatment market segment, attractive business opportunities include sales of compact water treatment units, air blowers, filters, boosters, chemicals, pipes, valves, and turbines. Egypt is also one of the largest water pump markets in the world. Imports of water pumps in Egypt totaled $100 million in 1999 and the market is expected to grow over the next few years by 15 percent annually. The public sector’s market share of imported water pumps is 70 percent. In the water and wastewater market, the best sales prospects for pumps are for horizontal end-suction water pumps, split case water pumps, and feed water boiler pumps.
Most of the money for imports of U.S.-manufactured industrial wastewater treatment equipment is likely to come from Egyptian private-sector industries, since grants are generally not available in this market segment. The World Bank has established a $39 million Pollution Abatement Fund under the Egypt Pollution Abatement Project to finance environmental investments through local commercial banks. To qualify, the Egyptian firms must be financially viable existing public and private enterprises. The eligible projects are investments in pollution prevention and effluent pre-treatment.
The biggest opportunities in industrial wastewater treatment will be in food processing (sugar, edible oils, onion dehydration); cement, steel and iron; chemicals and fertilizers; and textiles, especially at factories located along the Nile River.
In the short term, demand will be for unsophisticated technologies that treat the most obvious pollutants and are easily operated and maintained. Process changes, improved housekeeping, and water conservation and reuse will be priorities. In addition, some of the existing systems are not in working condition due to a lack of spare parts and trained operators, which creates a market for spare parts and consulting services.
India
Population: 1.014 billion (2000)
Urban population: 28 percent (2000)
GNP per capita: $450 (1999)
GDP average annual growth rate: 6.1 percent (1990–1998)
Water supply coverage (urban/rural): 92 percent/86 percent (2000)
Sanitation coverage (urban/rural): 73 percent/14 percent (2000)
Market Overview
It is estimated that 70 percent of India’s surface water resources are severely polluted. Municipal sources account for about three-fourths of total wastewater generation in volume and almost one-half of the total pollution load in the country. In the industrial sector, although 75 percent of the large and medium-sized enterprises have installed adequate effluent treatment facilities, small-scale industries (particularly in textile, electroplating, and food processing sectors) still lag behind in terms of regulatory compliance.
In India’s 23 largest cities (with population of more than 1 million), only 31 percent of wastewater is treated. Three of them have only primary treatment facilities and 13 have both primary and secondary treatment facilities. The biological systems for secondary treatment installed by the municipalities/water supply and sewerage boards of these metro cities include trickling filters, activated sludge with compressed aeration and activated sludge with mechanical aeration, and oxidation ditch technologies. As a result, the quality of India’s water supply is very poor: only 20 percent of the available drinking water meets health safety standards.
The key factors contributing to the poor operation and maintenance of India’s water and wastewater systems are the lack of funding, inadequate data, designs, and survey plans, poor personnel training, and the lack of monitoring. All publicly owned water and wastewater utilities continue to experience economic constraints owing to extremely low user fees for water and wastewater treatment services, limiting their investment potential. Existing water connection charges and user fees are highly subsidized. To meet the funding requirements, a number of utilities/municipalities are trying to raise resources from the municipal debt market.
The 2000 total annual water and wastewater market in India was estimated at almost $1.2 billion, with the import market size at about 40 percent of this number, or $472 million. The level of spending in this sector has been increasing at an average rate of 14 to 15 percent over the last four to five years.79 The main drivers for this growth are the increased enforcement in the industrial segment and sustained infrastructure funding from multilateral development banks in the municipal segment.
Regulatory and Institutional Framework
India has a comprehensive legal framework for water pollution control. The Central and State Pollution Control Boards implement the Water Act of 1974. The Central Board formulates standards, while the State Boards are in charge of planning and executing environmental programs, including enforcement. Under the 1986 Environmental Protection Act, the Central Board establishes discharge standards on the basis of best available technology, but the State Boards are authorized to apply more stringent standards for a specific category of industries under their jurisdiction, if required. The Water Cess Act of 1977 stipulates the collection of water user fees from certain categories of industries.
There is a clear trend in India’s environmental regulations to prescribe more enforceable mass-based loading limits for effluents rather than concentration-based wastewater discharge standards, thereby increasing the demand for effluent treatment technologies. The sharp increases in water user fees and the central government’s intent to apply them to all industry sectors rather than only select ones drives Indian industry to identify and exploit opportunities for water conservation. An ongoing policy debate is concerned with the integration of appropriate market-based instruments into the existing command and-control regulatory regime to provide incentives for cleaner technologies and pollution prevention.
Table 4.6 Estimated Size of the Water and Wastewater Technologies Market in India, 2000
(millions of U.S. dollars)
| Local Production | Imports | Total Market Size | Growth Rate 2000-2001 |
| Water Treatment and Supply | 593 | 395 | 988 | 13% |
| Wastewater Treatment | 115 | 77 | 192 | 15% |
| Total | 708 | 472 | 1,180 | |
Sources: “India: Water and Wastewater Treatment Market” (2000) and “India: Wastewater Resource Development Equipment” (1999), Industry Sector Analyses, U.S. and Foreign Commercial Service and U.S. Department of State.
There is also a noticeable trend among leading Indian companies to obtain Environmental Management Systems (ISO 14001) certification for better corporate visibility and global outlook. Over 90 companies in diverse industry sectors have already obtained ISO 14001 certification. The growing acceptance of ISO 14001 is likely to generate demand in the area of industrial pollution prevention and waste minimization.
Privatization
The government continues to dominate India’s infrastructure sectors. Although there is a policy debate on the need to privatize the existing publicly owned water and wastewater treatment works, official policy and guidelines are yet to be framed to give a definite direction to the marketplace.
However, many of India’s state and local governments are bringing private sector financing into the development of urban water supply and sewerage systems. Many Indian cities and water boards are entering into service and management contracts to improve the quality of service and reduce costs. These contracts range from labor and service (in almost all Indian cities) to operation and maintenance of water and wastewater treatment plants (for example, in Chennai and Mumbai). BOT and BOO schemes have been implemented in the cities of Tirupur, Pune, Hyderabad, Bangalore, Goa, Kolhapur, Dewas, and Cochin. The following are just three examples of numerous public-private partnerships in the water and wastewater sector in India:
- The Pune Municipal Corporation has contracted the operation and maintenance of the water supply system to a private company.
- In Chennai, municipal authorities have contracted out the operation and maintenance of 75 pumping stations and are planning to do it for other water supply services.
- A new development program in Tirupur, Corporation Limited, is implementing a $330 million, 30-year comprehensive BOT scheme for the city’s water and sewerage system that would rely for its profitability on the collection of increased water and wastewater fees. The project will supply 185 million liters of drinking water per day and will build a 55 km-long pipeline and about 350 km of water distribution network, drinking water and wastewater treatment plants, pumping stations, and conveyance facilities.
Trade and Investment Policy
India’s new Export-Import Policy announced in April 1999 signifies a move in the direction of a more liberal trade regime. India has recently reduced tariffs and removed quantitative restrictions on many items. Import tariff rates have been reduced from a peak rate of 300 percent in 1991 to a ceiling of 30 percent in the 1999/2000 budget. Customs duties for energy-efficient equipment and certain pollution control equipment are lower (5 to 15 percent). India is committed to a phased reduction in duty rates in line with its membership in the WTO.
The new industrial policy introduced in 1991 marked a major shift in India’s investment climate, relaxing or eliminating many restrictions on investment and simplifying the investment approval process. The government has expanded the list of industries eligible for automatic approval of foreign investments and also raised the upper level of foreign investments from 51 to 100 percent in 1998. Although the current government led by the Bharatiya Janata Party has taken a more nationalistic stand and advocated a protectionist “swadeshi” (made in India) approach to the economy, it continues to encourage foreign investment in core infrastructure sectors.
As part of its long-time confrontation with Pakistan, India conducted a series of nuclear tests in May 1998 which resulted in the imposition of economic sanctions by many countries, including the United States. Although the Indian government is trying to downplay the negative effect of the sanctions (they do not affect the activities of the U.S. Trade and Development Agency, U.S. Ex-Im Bank, and OPIC in India), they are taking a certain toll on the country’s economy as a whole (due to the reduced foreign assistance) and on the U.S.-India trade and investment climate.
The United States continues to be India’s largest trade and investment partner. The potential for expanded trade and investment is enormous but dependent on the future of Indian economic reforms. Under a bilateral trade agreement signed in January 2000, India has agreed to lift more than 1,400 specific trade restrictions for U.S. products by April 2001. However, India is not a member of the Paris Convention on intellectual property protection and does not have a bilateral patent agreement with the United States, which hampers U.S. investment in India.
U.S. Market Share and Competition
More than half of India’s market demand for water and wastewater equipment is met by local manufacturers. The current annual turnover of Indian private water and wastewater companies is about $700 million. Out of this amount, almost 90 percent comes from equipment suppliers and the rest from the consulting business (most equipment manufacturers also offer feasibility assessments and engineering consulting services). Most Indian water equipment suppliers produce pipes, water pumps, valves, and other relatively unsophisticated equipment. Some of the major Indian companies in this sector are Larsen and Toubro, Subhash Pipes, the GVK Group, Thermax Ltd., Jain Pipes Ltd., and Triveni Engineering & Industries Ltd.
The U.S. Commercial Service estimates the U.S. share of the import market at about 25 percent in 2000, up from 17 percent a year before. European firms, especially from France (Vivendi and Degremont), the United Kingdom (Biwater, Bovis Group, Thames Water), and Germany (the Krupp Development Group, Nestler) are very strong competitors. European companies have gained their position because they market aggressively, and their governments extend financial aid to India in connection with water infrastructure development projects. South Korean firms also play a significant role in the Indian water equipment market.
Very often, Western technologies are considered to be expensive in India. To overcome this barrier and remain competitive, it is important to compare both the capital and operating costs of equipment with comparable costs of competing equipment. In many cases, a little higher capital investment for equipment would result in lower daily operating costs for the end user. This analysis must be part of marketing strategy since the offered up-front costs of product/services considerably impact the final decision of the end users in India.
Forming a strategic alliance with the right Indian partner is perhaps the most important aspect to getting a niche in the local market. Affiliation with reputable and knowledgeable local partners helps considerably in building relationships directly with end users, adapting to local business cultures, keeping abreast with vital market information and in dealing with local issues. The long-term strategic alliance creates competitive advantage and solid business growth. Therefore, alliances must be forged on a long-term basis. Businesses choosing the local partner should carefully and cautiously consider this fact when considering a local partner.
Indian industry prefers joint ventures or technology licensing agreements where the Indian partner manufactures equipment in India and imports either the design or the core process from abroad. Under such arrangements, Indian companies can manage on-site execution of projects, with the U.S. partner providing the required technological expertise. This approach generates cost savings and competitive advantages for U.S. firms.
Market Opportunities
In the coming years, the level of investment is likely to be higher in India’s municipal water and wastewater treatment market segment compared to the industrial one and would be primarily driven by assistance from external donor agencies.
The World Bank and the Asian Development Bank have been the principal sources of external financial assistance. The following are key World Bank and Asian Development Bank projects in water supply and sanitation that are of potential interest to U.S. companies:
- Third Chennai Water Supply and Environmental Sanitation Project (World Bank, $200 million). The project will finance the rehabilitation and expansion of water distribution and sewerage system improvements, including low-cost sanitation.
- Second Hyderabad Urban Water Supply and Sanitation Project (World Bank, $180 million). The project includes the reorganization of the Hyderabad Metropolitan Water Supply and Sewerage Board; reduction of water losses; rehabilitation and expansion of water supply systems; and strengthening and expansion of the sewerage system.
- Rajasthan Urban Infrastructure Development Project (Asian Development Bank, $250 million). This project will finance, among others, a water supply rehabilitation and expansion program and a wastewater management program.
- Karnataka Urban Development and Coastal Environmental Management Project (Asian Development Bank, $175 million). The project will support improvements in water supply and sanitation in the Bangalore sub-region.
Significant market opportunities are also created by the increased public sector funding for water and wastewater infrastructure in India. Under its ninth five-year plan (1998-2002), India’s central government will allocate $300 million for urban and rural water supply projects. The central government-sponsored National River Action Plan is a large source of investments in municipal wastewater treatment. The plan is worth about $486 million and covers a total of 141 towns in 14 states. In addition, the Indian government has also approved clean-up programs for the Gomti, Yamuna, and Damodar rivers, amounting to $135 million. These upcoming investments bring good business prospects for U.S. companies for providing wastewater treatment equipment and services.
There is growing policy support in India for common effluent treatment plants for clusters of small-scale industries. In 2000, there were a total of 101 plants around the country. State governments are spending substantial amounts of money for the promotion of these plants. For example, the Delhi government has undertaken an ambitious project to construct 15 plants for 22 industrial estates in the city. Each common effluent treatment plant is expected to cost about $1.7 million. While 50 percent of this cost will be met by local industries, the Delhi government would provide the remaining 50 percent.
The number of industrial units in common effluent treatment plants could be anywhere between seven and 2,200, but generally varies between 50 and 100. They typically include a screen/grit chamber, equalization tank, flash mixer, clariflocculator, send filter, aerator, sludge thickener, rotary vacuum filter, and an activated carbon column as part of the treatment chain. These plants represent promising opportunities for U.S. companies producing these technologies.
Table 4.7 Technology Best Prospects in India’s Water and Wastewater Treatment Sector
Subsector | Best Prospects |
| Water distribution systems | Pumps, valves, motors, compressors, storage tanks, repair equipment for leaking pipes, meters |
| Municipal water treatment | Ultraviolet disinfection systems, advanced reverse osmosis and membrane filtration systems, aerators, decanters |
| Municipal wastewater treatment | Advanced oxidation systems, energy efficient aerators, upflow anaerobic sludge blanket systems |
| Industrial wastewater treatment | Rotary bio-disc systems, sequencing batch reactor systems, automatic chemical dosing systems, oil removal systems, industry-specific pollutant removal/reduction systems |
| Analytical/monitoring equipment (for all sub-sectors) | Auto-analyzers for phosphorus and nitrogen, thermohydrographs, total organic carbon analyzers, electronic flow meters, continuous pH meters, spectrophotometers, data loggers |
Sources: “India: Water and Wastewater Treatment Market” (2000) and “India: Wastewater Resource Development Equipment” 1999), Industry
There are a number of industrial estates that rely on treated wastewater from municipal wastewater treatment plants for their water needs; for example, the Manali industrial estate in Chennai. U.S. companies having expertise in water recycling may have a competitive edge in this emerging market niche in India.
The demand for water and wastewater testing and analysis equipment is primarily driven by regulatory enforcement. The growth in this market segment has been relatively low in the last three decades. However, the recent enforcement strengthening trend may create new opportunities. Many state pollution control boards have undertaken major programs to enhance in-house monitoring and analysis capabilities. Moreover, large and medium-sized industrial facilities are also important buyers of state-of-the-art monitoring and analysis equipment and services, since they are now required to regularly monitor their own discharges.
India’s private financial institutions are an important source of financial assistance for water and wastewater projects. The most important ones include the Industrial Finance Corporation of India (IFCI), the Industrial Credit and Investment Corporation of India (ICICI), the Industrial Reconstruction Bank of India (IRBI), and the Industrial Development Bank of India (IDBI). IFCI, ICICI, and IDBI provide direct financial assistance (at a 15.5 percent interest rate, for up to 75 percent of the project cost) to large and medium-sized industries to install effluent treatment plants. ICICI also supports technology development ventures, while IRBI provides credit and investment needed for rehabilitation of industrial projects.
Infrastructure Leasing & Financial Services, a private venture capital fund, recently raised $250 million from debt market for Ahmedabad Municipal Corporation to be used for improving the city’s infrastructure and $425 million for the Tirupur Industrial Area wastewater management project. The Housing Urban Development Corporation has recently created a new urban infrastructure fund that also provides loan assistance to urban water supply and sewage treatment projects. The total loan assistance approved under the fund in 1997-98 was $20 million.
U.S. exporters should take advantage of opportunities created by U.S. assistance programs in India. For example, under USAID’s Urban and Environmental Credit Program, a loan guarantee of about $25 million helped launch South Asia’s first municipal bond for improvement of water, sewerage, and waste collection systems. This bond, for the city of Ahmedabad, has encouraged 13 other Indian cities to seek credit ratings for future bonds or other debt instruments to finance environmental infrastructure projects. USAID assistance also helped catalyze the Tirupur water supply and sewerage BOT project. The U.S. engineering firm, Bechtel, is part of the consortium that was awarded this project.
In 2000, the U.S. Ex-Im Bank announced a new line of credit of $500 million (with $100 million reserved for environmental infrastructure projects) for U.S. firms trying to access the Indian market. US-AEP’s technology representatives in New Delhi, Mumbai, Chennai, and Calcutta are working to identify appropriate partners for U.S. firms in the field.
Japan
Population: 127 million (2000)
Urban population: 79 percent (2000)
GNP per capita: $32,230 (1999)
GDP average annual growth rate: 1.5 percent (1990-1998)
Water supply coverage (total): 96 percent (1990-1996)
Sanitation coverage (total): 100 percent (1990-1996)
Market Overview
Almost 30 percent of rivers and about 60 percent of lakes and reservoirs in Japan exceed national water quality standards, primarily because the country has been slow to develop municipal wastewater treatment systems and has not sufficiently enforced industrial effluent standards. In addition, the rapid growth of metal plating, precision machinery, and electronics industries has led to increased discharges of organic chlorine solvents.
The market for wastewater treatment equipment in Japan was estimated at $6 billion in 1996. The market is growing at a rate of 5 to 8 percent a year and is expected to exceed $10 billion in 2010. The Ministry of Construction’s eighth sewerage development plan envisioned spending over $217 billion on municipal wastewater treatment between 1996 and 2002.
Regulatory and Institutional Framework
Japan’s Water Pollution Control Law, which was amended in 1996, establishes two categories of national effluent standards, one for public health and one for environmental protection, that are implemented by the national environmental agency. Prefectural and municipal governments can promulgate more stringent standards if warranted by local environmental conditions.
Prefectures and municipalities are responsible for water supply and sewerage within their jurisdictions. Japan’s municipal water supply and sewerage infrastructure is publicly owned and operated.90 The Ministry of Construction is in charge of implementing water and wastewater infrastructure development projects.
Trade and Investment Policy
The Japanese government has removed or liberalized most legal restrictions on foreign investment. However, direct foreign investment levels have remained small relative to the size of the economy, reflecting a range of long-standing structural impediments, including:
- a high overall cost structure that makes market entry and expansion expensive;
- corporate practices and market rules that inhibit foreign acquisition of Japanese firms; and
- exclusive buyer-supplier networks and alliances, still maintained by some Japanese companies belonging to the same business grouping (or keiretsu), which limit competition from foreign firms.
There are no regulations restricting the access of foreign manufacturers to the Japanese market. The Japanese government subsidizes purchasers of environmental equipment, both domestically produced and imported, by granting special tax deductions or low-interest loans.
Japan has instituted a number of programs to support imports that are administered through the Japan External Trade Organization (JETRO). JETRO’s activities are designed to support industrial cooperation, promote two-way direct investment, and disseminate market information. JETRO’s Technology Tie-up Promotion Program links foreign companies with their high-tech Japanese counterparts for various types of strategic alliances, including joint ventures, joint research and development projects, and technology imports.
U.S. Market Share and Competition
The market is highly competitive with a large number of Japanese suppliers. There are about 120 water and wastewater equipment manufacturers in Japan, nearly half of them large companies. The main players are the Ebara Corporation, Kubota Corporation, Kurita Water Industries, and Mitsubishi Heavy Industries, which have a combined 27 percent share of Japan’s water and wastewater equipment market. Ebara manufactures a great variety of water supply and treatment equipment (filters, water conditioning equipment, membranes, pumps, valves, etc.), as well as wastewater treatment equipment (effluent recycling systems, physical and biological treatment systems, chemicals, sludge handling equipment, etc.). It also provides plant design and construction, process engineering, and consulting services. Mitsubishi offers a similarly wide array of equipment and services in this market. Kurita specializes in membrane technologies, wastewater treatment chemicals, and sludge reduction systems. Kubota is a major pipe manufacturer. Japanese companies have managed to satisfy most of the market need by adapting relevant technologies that already exist in the country.
The Japanese government also sponsors the development of new water and wastewater technologies by domestic suppliers. For example, the ACT-21 technology development project (to be completed in 2001) targets the design of new drinking water treatment and treated wastewater recycling technologies.
There is no publicly available information on Japan’s imports of water and wastewater equipment, since Japan has no customs classification on environmental products. However, indirect evidence shows that these imports are insignificant. In cases where foreign equipment is used, it is usually produced locally under licensing arrangements rather than imported. Foreign companies find it difficult to compete in the Japanese market due to the considerable time and costs required to modify equipment to meet regulatory standards and various local user specifications. The top two exporters of wastewater equipment to Japan are the United States and Germany.
U.S. water and wastewater equipment suppliers have been successful in the Japanese market in a few technology areas, including reverse osmosis and nanofiltration technologies, as well as water quality analysis instrumentation. The successful U.S. companies (Dow Chemical, Pall Corporation, Perkin-Elmer, Millipore, and several others) have established themselves in Japan for the long term and maintain local wholly owned subsidiaries. U.S. firms have to compete against local suppliers not only in price and technology, but also in maintenance costs, energy, and space efficiency, which is so important in Japan. The long-term competitiveness of U.S. companies doing business in Japan also depends on their ability to be very customer-oriented and meet the extremely high Japanese standards for quality, product durability, and after-sale service.
Market Opportunities
The activated sludge process has been used in Japan extensively for decades for both municipal and industrial wastewater treatment. However, in recent years, the anaerobic digestion process has become increasingly popular because of its smaller required installation space, lower operating costs and sludge volume generated. This trend creates opportunities for U.S. exporters of this technology. Other best sales prospects include high-performance filters, industrial wastewater recycling systems, sludge dehydration equipment, as well as sampling, analytical, and monitoring instrumentation.
Machinery manufacturing, food processing, steel, and chemical industries present the greatest opportunities for suppliers of industrial effluent treatment equipment.
Mexico
Population: 99 million (2000)
Urban population: 74 percent (2000)
GNP per capita: $4,420 (1999)
GDP average annual growth rate: 3.1 percent (1990–2000)
Water supply coverage (urban/rural): 94 percent/63 percent (2000)
Sanitation coverage (urban/rural): 85 percent/32 percent (2000)
Market Overview
Mexico’s water market is the single most important market for U.S. exports of environmental equipment and services because of the need for infrastructure investments, the country’s proximity to the United States, and the strong trade relationship between the United States and Mexico.
Currently, more than 13 million urban residents in Mexico do not have access to potable water due to the lack of infrastructure. The number is much higher in rural areas. The mismanagement of water supplies is also a big problem - an estimated 40 percent of potable water is lost through leakage. There has been some improvement over the last few years. For example, the percentage of residents having access to potable water has increased to 87.4 percent.
Wastewater treatment, both industrial and municipal, is inadequate. Only 17 percent of wastewater is treated at all, and only 12 percent to regulatory standards. Sixty percent of industrial wastewater is discharged directly into open waters. It is estimated that Mexico will have to invest approximately $7.2 billion and spend about $1 billion annually to meet wastewater treatment standards.
According to the country’s National Water Commission (CNA), only about 8 percent of industrial wastewater and 15 percent of municipal sewage is treated. Nearly one-quarter (200) of the existing municipal wastewater treatment plants are out of operation. While the largest corporations have made real improvements in treating their wastewater, the same cannot be said for smaller companies.
Two areas of Mexico are facing particular problems with respect to water and wastewater. The first is Mexico City, home to 20 million people. Mexico City must supplement its meager local water resource at great cost by pumping water from 127 kilometers away. In addition, over exploitation of aquifers for drinking water has resulted in rapid land subsidence (at the rate of 50 centimeters annually) and damage to the infrastructure. In addition, the capital city alone accounts for 50 percent of the sewage collection in the country, and the sewage treatment is inadequate. In fact, Mexico City’s sewage flows into a river used for irrigation purposes, creating a substantial human health hazard.
Another area with acute water-related problems is the U.S.-Mexico border, which stretches 2,000 miles. The operation of some 2,000 maquiladoras (in-bond plants that operate under special Mexican customs treatment and preferential foreign investment regulations) has produced an enormous population shift to the border region, where there was little infrastructure to support the booming development. The lack of adequate drinking water supply infrastructure and disposal of untreated industrial and municipal effluents (sometimes directly into the sources of drinking water) have resulted in severe health risks to the border communities.
The Mexican government recognizes water and wastewater management as one of the top priorities of its market-oriented program. Water prices have risen dramatically in recent years as the government has removed subsidies and begun to implement cost-recovery pricing. The other major direction of the government program was to involve the private sector (mostly through 10 to 15 year concessions) in the improvement and management of Mexico’s water and wastewater infrastructure. With the exception of rural areas, the government expects much of the funding for new and rehabilitated wastewater treatment plants to come from the private sector. The United States has been very active in this region, investing approximately $2.5 billion dollars to address environmental infrastructure needs of border communities.
These programs, together with a huge need for investment, have created a large water and wastewater market in Mexico. Its size was expected to reach $2.39 billion in 2000, with annual growth of about 10 percent. The water supply market segment alone was estimated at $1.9 billion in 1999, with a 5 to 7 percent growth rate per year. The industrial wastewater treatment market is much smaller, just $94 million in 1998, but is growing at a much faster rate of 16 to 18 percent annually. The share of imports in the overall market is about 80 percent.
Regulatory and Institutional Framework
The system of effluent permits is a key element of Mexico’s water and wastewater management program. The previous system of industry-specific effluent limits was replaced in 1997 with a simpler system based on specific pollutants and the type of receiving waters (for direct discharges). Although the standards are tougher in heavily contaminated areas, they are, overall, less stringent than under the previous regulation and allow municipalities to limit themselves, in most cases, to primary wastewater treatment.
Compliance deadlines for municipalities vary depending on their population: the year 2000 for cities and towns with over 50,000 residents, and 2005 and beyond for smaller communities. Industry compliance deadlines are based on daily BOD discharge volumes and are, similarly, the year 2000 for facilities discharging more than 3 tons/day, and 2005 and beyond for those that discharge less.
At the federal level, the CNA has ultimate responsibility for water resources and is responsible for enforcing effluent standards for direct discharges.
Each of the states has its own water law, which determines how water services are provided and the way in which water tariffs are set. These laws also specify how much private participation is allowed in the provision of services and development of infrastructure.
Mexican municipalities are responsible for providing water and wastewater treatment within their jurisdictions. New regulations covering discharges into sewerage systems were promulgated in 1998. Since the municipality is responsible for the quality of the wastewater it discharges to open waters, it has an incentive to ensure that industries pretreat their effluents and comply with standards for indirect discharges. Otherwise, the municipality must pay related effluent charges. One important characteristic of the regulatory climate is the tension between federal and local governments regarding large municipal water and wastewater projects. Priority municipal wastewater projects in Mexico City and Guadalajara have been stalled due to political disputes between the federal and local governments.
CNA’s staff shortages and the limited availability of monitoring equipment have impeded enforcement of water laws in Mexico. Enforcement efforts were reduced in the wake of the 1995 economic crisis (in order to avoid even higher unemployment) but are picking up again. Under a recent regulation, state and municipal authorities are now responsible for enforcing the standards for small and medium-sized enterprises. At the same time, there are discussions about integrating CNA’s enforcement activities with those of the Office of the Attorney General for Environmental Protection, which prosecutes environmental violations not related to water.
Rapidly rising water prices are encouraging voluntary compliance by industry, since companies are allowed to draw free water to match discharges that meet new standards. Federal tax incentives, including immediate depreciation of environmental investments, also stimulate voluntary compliance efforts.
Privatization
In 1996, there were 360 municipal water utilities in Mexico, 207 of them financially autonomous, and the rest receiving government support.105 Many municipalities have been having difficulty managing their responsibilities to provide water supply and sewerage services to the population. The infrastructure was usually built by the federal government, and local councils have little experience with the technical and financial issues involved.
The Mexican government has chosen to pursue a number of strategies to involve the private sector in the water and wastewater infrastructure markets. These strategies include integrated concessions, management contracts, partial concessions, and BOT arrangements.
In the concession schemes, the local government provides a contract to a private operator for the operation of their entire water system (an integrated concession) or a portion of the water system (a partial concession). Two cities - Aguascalientes and Canc�n - have adopted integrated concessions. Although there have been a number of problems, the arrangements in these two cities are seen as successful. The replicability of these schemes is limited, however, by the uniquely affluent nature of these two cities.
Under a management contract arrangement, a private company is paid a fee for meeting improvement or performance benchmarks. This arrangement has proved successful in a number of cities including Mexico City and Puebla. Management contract schemes are likely to be implemented in other large cities and constitute an opportunity for U.S. firms with experience in water system management or that sell efficiency-enhancing equipment, services, or software.
The government has opted to involve the private sector through BOT projects in a number of areas. The Water Law of 1992 sets out guidelines for private sector participation in water supply projects in Mexico. However, the high capital costs and the risks of collecting water and wastewater fees from financially troubled municipalities have made the envisioned wide-scale implementation of the BOT program difficult. Out of 40 BOT projects planned in 1993, only eight were operational in 1998.
The federal government in most cases cannot step in to help assure private investor repayment. Water utilities that can show a strong balance sheet (only an estimated 10 percent of them can), or projects which by themselves can demonstrate a low level of commercial risk, are eligible to benefit from the Public Works and Services Bank revolving contingency fund. This fund has been used to absorb some of the commercial risk associated with shortterm municipal failure-to-pay. The mechanism, though limited, has been indispensable in closing financing for most municipal BOT wastewater projects. Projects with access to international funding are clearly the most attractive to investors and equipment suppliers.
The shortage of funds is causing a trend toward regional projects that would cover the needs of more than one municipality. The state governments are also encouraging the integration of water supply and wastewater treatment projects under one BOT scheme.
Trade and Investment Policy
Mexico’s trade policy toward the U.S. has been influenced by the requirements of NAFTA, which was enacted in 1994. NAFTA continues to be a key factor in boosting Mexico’s imports and raising its overall level of economic activity, as well as spurring competitiveness and institutional reform. To comply with NAFTA requirements, Mexico has further lowered its tariffs on goods originating in the United States and Canada. Mexican tariffs on U.S. goods are now between 0 and 10 percent of value. Eighty-five percent of U.S. goods now enter Mexico duty-free. Additionally, Mexico has abolished its import licensing requirements for most goods that originate in the United States.
The 1993 foreign investment law has opened more areas of the economy to foreign ownership. It has also provided national treatment for most foreign investment, eliminated all performance requirements for foreign investment projects, and liberalized criteria for automatic approval of foreign investment proposals.
Since Mexico is a neighboring country, it is a natural market for U.S. companies. U.S. exporters have a great competitive advantage in Mexico due to the political, economic, and cultural ties between the two countries. Underlying the strong U.S. position is also a genuine respect for and interest in U.S. products and companies. Mexico largely embraces U.S. standards, business practices, and consumer styles. In 1997, Mexico overtook Japan as the second-largest importer of U.S. goods, second only to Canada. In 1999, the United States accounted for 74 percent of Mexico’s imports.
U.S. Market Share and Competition
The demand for water and wastewater equipment and services from U.S. firms is expected to grow at an annual rate of about 14 percent in the short term. U.S. imports in this market equaled $1.4 billion in 2000, 108 with an import market share of up to 70 percent, depending on the market segment (see Figure 4.4). U.S. firms have a natural competitive advantage in the Mexican market due to geographic proximity, U.S. bilateral aid, the free trade regime under NAFTA, and the established reputation of U.S. products. Other imports come mainly from Japan (which has recently been increasing its market share), Germany, France, and the United Kingdom.
Figure 4.4 Import Market Shares for Water and Wastewater Technologies in Mexico
Water Supply
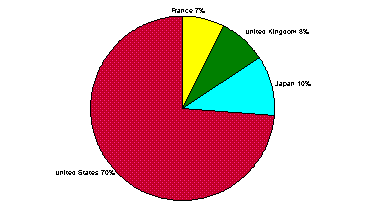
Wastewater Treatment
Sources: U.S. and Foreign Commercial Service and U.S. Department of State, Potable Water Resource Equipment (Washington, D.C., 1998); and ibid., Industrial Wastewater Treatment and Recycling Equipment (Washington, D.C., 1997).
Local production accounts for about 20 percent of the total market. Mexico has over 350 local manufacturers of water and wastewater equipment, 95 percent of which are small and medium-sized companies. However, Mexican companies produce only basic water equipment. The most common problems faced by domestic manufacturers are low-scale production, high costs, and obsolete technology.
Market Opportunities
Opportunities exist at all levels for U.S. companies in the Mexican water and wastewater market. Table 4.8 identifies some of the market opportunities in Mexico. The Mexican government actively supports water and wastewater projects. The federal government designed the National Program for Potable Water and Sewerage in Urban Zones (APAZU) to support local water utilities in improving their services. The program provides matching funds to improve administrative, financial, and operational efficiency, and to upgrade infrastructure. CNA has plans to invite private companies to build and/or modernize municipal wastewater treatment plants under the BOT scheme in the states of Guerrero, Veracruz, San Luis Potos�, Puebla, Tlaxcala, Hidalgo, and Michoacan. CNA also has projects to modernize the potable water distribution and sewage systems in the cities of Pachuca, San Luis Potos�, Huatulco, Acapulco, Canc�n, Tabasco, and Hermosillo, among others.
Table 4.8 Market Opportunities for U.S. Companies in Mexico
Level of Government | Type of Market Opportunities |
| Federal - National Water Commission (CNA) | Technology for water well drilling, water reinjection systems, emergency response, and water monitoring services |
| Municipal and State Level | Pumping stations, water networks, water metering, billing and collection systems, wastewater treatment, equipment maintenance, and potablization plants. |
Source: Mexico Environmental Technologies Export Market Plan, U.S. Department of Commerce, International Trade Administration, 2001.
Companies specializing in water utility operations may have opportunities through APAZU and other funding programs to help Mexican water utilities improve their efficiency, a top federal priority. Some of the principal competition here will come from low-cost, sole proprietors that operate in the Mexican water utility market. BOT projects are also a good market for U.S. engineering firms.
The municipal water supply and wastewater treatment market presents the biggest export opportunities for U.S. firms in Mexico. Private participation in the provision of potable water and sewerage is expected to grow as states and municipalities seek efficiency gains and to attract private capital.
At least 100 tenders are planned for the next five to 10 years to renovate and repair the existing drinking water distribution infrastructure in major cities, as well as to build or upgrade over 50 water or wastewater treatment plants. It is important to note, however, that the planned construction of wastewater treatment facilities under BOT arrangements has been slow as the cost of this infrastructure exceeds many local communities’ capacity to pay.
Under the present regulatory regime, most new municipal wastewater plants will now emphasize primary treatment with some exceptions, such as plants discharging into international waters on the border with the United States. Because primary treatment generally requires fewer imported components and expertise, most U.S. project developers and equipment suppliers should develop new strategies to add value in the wastewater treatment market. One such strategy includes targeting for treatment the substantial volumes of sludge that these treatment plants are likely to generate.
The best prospects for municipal water and wastewater treatment equipment include chlorinators, chlorine diffusers, chlorine contact chambers, mixed sludge pumps, primary clarifiers, PVC pipes, water meters, water filtration equipment, water pumps, valves, and water leak detectors.
A number of U.S. and international agencies have sponsored water and wastewater projects in Mexico. These include the U.S. Environmental Protection Agency (EPA), the U.S. Geological Service, the World Bank, NADBank, and the Border Environment Cooperation Commission (BECC). The U.S. EPA, NADBank, and BECC are making substantial investments in water supply and wastewater treatment infrastructure projects along the U.S.-Mexico border. These projects, and others along the border, are good possibilities for U.S. companies.
EPA is represented on both the NADBank and the BECC’s board of directors and is the primary source of construction grants for the projects. EPA grants are used to supplement funding for projects which cannot be completely financed by NADBank, state or local governments, or the private sector. The United States expects to provide $700 million in federal grants for water and wastewater infrastructure construction between 1995 and 2005; Mexico also provides significant grants. There are currently over a dozen NADBank water/wastewater projects in the U.S.-Mexico border area, with a total value of $400 million.
The industrial sector offers extremely good market opportunities for U.S. technology and services companies, particularly in wastewater treatment. This market is driven in large part by the need to comply with the new effluent standards. At the outset, the new standards will apply only to larger firms, but voluntary compliance is beginning to drive the demand from smaller scale operations. Many industrial parks or groups of smaller companies seek to install common treatment facilities to share design, construction, and maintenance costs. The largest demand exists in the sugar, beverage, petroleum, petrochemical, chemical, iron and steel, food processing, pulp and paper, and textile industries.
A number of constraints affect U.S. participation in the market for industrial wastewater treatment. The cost of capital remains high in Mexico, and many industrial customers are looking for relatively inexpensive short term solutions. Equipment that can be retrofitted to existing production systems is generally preferable to equipment that requires re-engineered technological processes. The best opportunities in industrial wastewater treatment are for ion exchangers, reverse osmosis modules, analyzers, chemical purifiers, automatic control instrumentation, etc.
In addition, systems designed for use in the United States tend to be engineered to minimize the number of required operators or technicians. This important selling point in the United States may hinder sales in Mexico. For one, many water utilities and industrial facilities in Mexico are more comfortable operating treatment plants manually instead of using sophisticated, automated systems, and believe that manual operation is a less expensive approach given Mexico’s low labor costs. U.S. firms must assess the degree to which their systems can be adapted to substitute labor for capital intensity, as well as educate their Mexican clients on the benefits of applying advanced, labor-reducing technologies.
Many companies also seek firms that can demonstrate technology performance under Mexican conditions. This is the result of Mexican clients’ unwillingness to accept perceived technology risk. Some foreign firms address this issue by initially accepting low profit margins in order to establish a track record in Mexico.
Finally, finding industrial wastewater treatment projects can be difficult. One strategy to circumvent this problem is to be in constant communication with chambers of commerce, associations, and industrial groups in Mexico.
Republic of Korea (South Korea)
Population: 47 million (2000)
Urban population: 82 percent (2000)
GNP per capita: $8,490 (1999)
GDP average annual growth rate: 6.1 percent (1990–1998)
Water supply coverage (urban/rural): 97 percent/71 percent (2000)
Sanitation coverage (urban/rural): 76 percent/4 percent (2000)
Market Overview
South Korea has made a substantial effort to provide adequate, clean water for its population. However, water resources remain at risk in terms of quantity and quality. With further urbanization and industrialization, the demand for water is on the rise. Many conventional water sources have already been tapped and the main water sources are becoming increasingly contaminated. The growing disparity between water supply and demand is likely to lead to more frequent, more prolonged, and more severe water shortages. South Korea’s anticipated water deficit will grow substantially over the next 10 years from 702 to 2,011 million m3 per year. On average, 28 percent of South Korea’s water is unaccounted for, due to unauthorized use and distribution system losses.
Only 68 percent of municipal sewage is treated. To bring this rate up to 80 percent in 2005, the South Korean government has committed to expanding basic water treatment facilities and enhancing the management methods. In 2001 alone, the government will construct 30 wastewater treatment facilities and 4,000 km of new pipeline at a value of $2.1 billion.
The South Korean government is currently implementing a plan to clean up the four major river basins in Korea: the Han River, the Keum River, the Youngsan River, and the Nakdong River. The Four River Basin Project’s objective is to improve ambient water quality to make the rivers suitable to serve as drinking water sources. The project includes the construction of 199 new wastewater treatment plants worth a total of $8.8 billion in investments by 2005.
The demand for water and wastewater technologies in South Korea went down briefly as a result of the 1997-1998 economic crisis but recovered quickly due to the successful large-scale corporate restructuring and the introduction of government incentives for foreign investment in South Korea.
The U.S. State Department estimates that the market size of South Korea’s water pollution control sector in 2000 was $3.4 billion. Government spending on water and wastewater is another indicator of market size. In 1999, for example, the South Korean government budgeted approximately $500 million for water and wastewater infrastructure improvements, including $200 million for water treatment and $300 million for wastewater treatment.
Regulatory and Institutional Framework
Several ministries and agencies in South Korea are involved in water and wastewater issues. The Ministry of Environment administers the Water Supply Act, the Sewerage Act, the Water Quality Preservation Act (which regulates industrial effluents), and the Environmental Policy Act, and is responsible for regulating, monitoring, and enforcing water quality control. The Ministry of Construction and Transportation and the state-owned Korea Water Resources Corporation (KOWACO) play the lead roles in water resources development and management, and infrastructure project implementation. Local governments have the responsibility to provide water and wastewater services to the population. At the same time, many other Korean agencies have overlapping water pollution control responsibilities, resulting in significant management inefficiencies.
Among the Ministry of the Environment’s major objectives for 2001 are the establishment of a drinking water demand management system and comprehensive water pollution control programs. The Ministry’s activities will include:
- The establishment of mandatory water demand management practices for water suppliers (for local governments and KOWACO) and every public institution;
- The introduction of water-saving companies to promote the use of water conservation and water recycling equipment;
- The promulgation of more stringent water quality standards; and
- The enactment and implementation of special management laws for each of the four main river basins, including more stringent effluent regulations and rigorous water monitoring systems.
Privatization
South Korea is beginning to undertake privatization of the water industry. South Korea’s privatization plans were first formulated in 1995. The government hopes that privatization will reduce the financial burden on central and local governments, accelerate the completion of water and wastewater infrastructure projects, promote the reform of local governments’ ineffective management systems, trim payrolls, and introduce the latest environmental technologies and services to South Korea.
Municipal water and wastewater utilities will mostly be privatized under a BOT system and will be eventually returned to the South Korean government. Presently, a portion of the water systems controlled by KOWACO are managed by private operators under franchise agreements.
Trade and Investment Policy
In line with its multilateral trade and other commitments, including those with international financial institutions, South Korea has undertaken changes in its trade policy framework. Import tariff rates have been adjusted in accordance with South Korea’s binding WTO commitments. Presently, import duties for pollution control equipment are at about 6 percent. Efforts have also been made to streamline customs clearance procedures by, among others, introducing an immediate release system and the progressive introduction of an electronic clearance system.
In addition to advance implementation of the WTO agreement on trade-related aspects of intellectual property rights, protection of such rights has been strengthened by new treaties, increased international cooperation, and stricter enforcement. The 1998 Foreign Investment Promotion Act has opened 99 percent of industrial sectors to foreign investment, simplified administrative procedures, and expanded tax incentives for high-technology investments. Trade and foreign investment liberalization has also contributed to intensified competition in the domestic market.
The United States is one of South Korea’s main trading partners (in addition to the European Union and Japan). In fact, South Korea is the United States’ sixth-largest export market, bigger than those of Australia, Brazil, China, France, or Italy. U.S. exports to South Korea are increasing and are expected to continue to show double-digit growth. The European Union is the main competitor in this market and has overtaken the United States as South Korea’s largest investor. Although there is no bilateral trade agreement between the United States and South Korea presently, both parties have been working toward crafting one.
U.S. Market Share and Competition
Local manufacturing accounts for 60 percent of South Korea’s water and wastewater market. Almost all municipal water and wastewater treatment projects in South Korea have been awarded to large local environmental engineering and construction companies, many of which are affiliated with such large industrial conglomerates as Hyundai, Samsung, Sunkyoung, Ssangyong, Halla, and Lotte. However, in order to be competitive, South Korean companies need state-of-the-art technology, much of which is offered by U.S. suppliers.
Some South Korean companies invest in the development of cutting-edge technologies (for example, Keumho Construction has invested $2 million to design a high efficiency wastewater treatment process) and often look for joint venture partners to leverage their capacity. These joint ventures offer excellent opportunities for U.S. companies and provide a source of superior technology for South Korean projects. It is important to note, however, that the South Korean government is investing heavily in the growth of its own environmental technology industry. Eventually, even a larger share of market demand will be met domestically. For now, however, U.S. companies can still play a large role in the South Korean water and wastewater market.
Currently, the U.S. share of the South Korean environmental market is 20 percent.119 The information on the U.S. share of the water and wastewater market was unavailable at the time of this writing.
International reputation, reliability, and price are the most important factors in government procurement decisions for municipal projects in South Korea. Product specifications are determined by the state-run Environmental Management Corporation, and the equipment is purchased through the Supply Administration of the Republic of South Korea.
Market Opportunities
In 1996, the South Korean government established comprehensive measures for water quality management. Under these measures, the government will invest $23.8 billion in the construction of municipal wastewater treatment facilities by 2005 and $51.8 billion in the water supply infrastructure by 2011.
The Four River Basin Project offers abundant opportunities related to large infrastructure projects. Its Nakdong River clean-up includes $52.3 million for the construction of new sewage treatment plants, $114.3 million for municipal wastewater treatment upgrades, and $93.9 million for the rehabilitation of the sewerage network in the Taegu metropolitan area. The Youngsan River clean-up includes the construction of 37 new municipal wastewater treatment plants worth $1.5 billion in the Kwangju metropolitan area. Under the Keum River cleanup, the government will finance the construction of 25 municipal and 10 industrial wastewater treatment plants. Finally, the Han River and Paldang Reservoir component will pay for the construction of sewage treatment facilities in rural areas ($739 million) and industrial effluent treatment plants at local industrial estates ($467 million). And these are just the main line items of the Four River Basin Project.
The best market opportunities for U.S. water and wastewater equipment companies in South Korea include the export of advanced wastewater treatment processes and technologies, water recycling technology, and other areas of advanced technology.
Saudi Arabia
Population: 22 million (2000)
Urban population: 86 percent (2000)
GNP per capita: $6,910 (1998)122
GDP average annual growth rate 1.6 percent (1990–1998)
Water supply coverage (urban/rural): 100 percent/64 percent (2000)
Sanitation coverage (urban/rural): 98 percent/91 percent (2000)
Market Overview
Saudi Arabia is an arid country with severe climate conditions and an absence of natural fresh water resources as well as high population growth, rapid urbanization, industrialization, and agricultural development, all of which make water one of the country’s most precious resources. The World Bank estimated that in 2000, Saudi Arabia’s water demand was five times the amount of available resources.
Desalination is the largest market segment in the country’s water sector. Saudi Arabia relies on desalination to help meet the large demand for water and has become the world’s largest producer of desalinated water, representing 30 percent of the world’s capacity.
Desalinated water accounts for roughly 30 percent of Saudi Arabia’s water supply. Currently, the country operates 25 desalination plants located at 15 major sites. Expenditures on desalination projects exceeded $6 billion during the Sixth Plan (1995-2000). The total desalination capacity was expected to reach 800 million gallons per day by the end of the year 2000.
Saudi Arabia currently uses four major desalination processes: multi-stage flash evaporation, reverse osmosis, electrodialysis, and vapor compression. The evaporation process is used at more than 90 percent of the desalination plants.
In 1998, the total market for desalination equipment in Saudi Arabia amounted to $357 million (the import market is 85 percent of the total) and was growing by 5 percent annually.
Saudi Arabia’s low supply of water resources has also created a significant demand for wastewater treatment equipment and services. The total volume of wastewater generated in Saudi Arabia is 4 million tons per day, of which only 30 percent is treated.126 It is estimated that 40 percent of municipal sewage could be recycled after treatment.
Regulatory and Institutional Framework
The principal agency involved in Saudi Arabia’s environmental policy development is the Ministry of Defense and Aviation, which includes the Meteorological and Environmental Protection Agency. This agency is responsible for the design of environmental regulations and enforcing compliance. It also administers the Environmental Protection Standards (1989), including effluent standards and reporting requirements for industry. New plants must use the best available technology to control their effluents.
The agency’s enforcement tool is to inform sectoral licensing agencies about environmental violations and request the suspension of the violators’ operating licenses. At the same time, its effectiveness as an enforcement agency is hampered by its position within the Ministry of Defense and Aviation (the country’s largest and most powerful ministry), where environmental issues are not a priority.
The other two important national agencies in the water sector are the Ministry of Agriculture and Water and the Ministry of Municipal and Rural Development. Local governments are responsible for water resources management within their jurisdictions. However, they are typically more concerned about economic growth than resource conservation.
The Saline Water Conversion Corporation (SWCC) is the sole government entity responsible for desalination projects under construction and the expansion of desalination plants.
Privatization
The Saudi Arabian leadership has embarked on a comprehensive restructuring of the entire Saudi economy. Annual population growth rates of over 3 percent, coupled with depressed levels of foreign investment, have led the government to place strong new emphasis on private sector expansion. Although desalination as well as municipal water and wastewater treatment are presently entirely in the government’s hands, this is likely to change in the near future. Given the fall in oil prices over the last decade and the corresponding drop in government revenues, the Saudi private sector is likely to gradually take over the construction, operation, and maintenance of water desalination projects on a BOT basis.
Trade and Investment Policy
Saudi Arabia’s Council of Ministers recently approved a new Foreign Direct Investment Code, which establishes a framework for future legislative and regulatory activities aimed at enhancing the country’s investment climate. It permits foreign investment in all but a few sectors and relaxes rules restricting foreign ownership of local businesses. The Council of Ministers also approved the establishment of the Saudi Arabian General Investment Authority to provide information and assistance to foreign investors.
Saudi Arabia is currently in the process of accession to the WTO. Once the country is admitted, its trade regime (currently plagued with regulatory and bureaucratic barriers) should become more transparent and accommodating to foreign businesses.
There are no restrictions on the import of water equipment into Saudi Arabia, although it is subject to a 12 percent tariff. Items manufactured locally are usually granted protection by raising the duty on similar imported items to 20 percent. All desalination equipment items and parts are exempted from any tariff duty if they are imported by or for plants run by the SWCC.
Although exporters are not required to appoint a local Saudi Arabian agent to sell to local companies, commercial regulations restrict importing and direct commercial marketing to wholly owned Saudi Arabian companies. In practice, local agents are a requirement. Agent/distributor relations are the responsibility of Saudi Arabia’s Ministry of Commerce.
Direct marketing does not play a large role in Saudi Arabia. Many forms of Western advertising are unacceptable due to Islamic religious beliefs and practices. Instead, personal relationships between buyers and sellers play a much stronger role in export success.
U.S. Market Share and Competition
The demand for increased desalination capacity generates tough competition between Saudi firms and foreign companies from Japan, the United States, Korea, Germany, and Italy.
Local production of water equipment is minimal in Saudi Arabia, accounting for about $5 million annually. For instance, about 98 percent of pumps, valves, and compressors are imported. However, domestic firms receive preferential treatment and are becoming more competitive as they increase their involvement in the market.
Domestically, five plants manufacture filters, pipes, treatment chemicals, sterilization units, and membranes used mainly in reverse osmosis systems. Two Saudi companies, Al-Kawther and Metito, are the most advanced in the design, manufacture, and commissioning of reverse osmosis plants in the country.
More than 30 foreign companies are active in Saudi Arabia’s desalination industry. In 1998, U.S. firms had a 16 percent share of the import market for desalination equipment (see Figure 4.5). U.S. assistance to the SWCC resulted in a better understanding of various desalination techniques used in the United States and how these techniques could be applicable to Saudi needs. U.S. companies dominate the Saudi market for reverse osmosis technology. U.S. firms have also supplied turbines, boilers, and generators for many multi-stage flash evaporation plants, although as of 1999, only two U.S. companies (Riley-Beaird and IHI) were prequalified with SWCC to supply multi-stage flash evaporation systems.
Figure 4.5 Import Market Shares for Desalination Equipment in Saudi Arabia
Source: Canada, Department of Foreign Affairs and International Trade, The Water, Wastewater and Desalination Market in Saudi Arabia, (Ottawa, 1997).
Both European and Japanese companies provide comprehensive work guarantees to the SWCC. U.S. firms, on the other hand, typically provide only manufacturer warranties for installed equipment, thereby reducing their competitiveness. Moreover, European and Japanese firms outnumber U.S. companies on the list of prequalified firms. Since many of the Saudi desalination plants were built by Japanese and European firms, most of the equipment and materials is sourced accordingly. Japanese, German, and Swiss consultants are major players in this industry, recommending specifications that favor companies from their countries.
The Saudi government follows a long-standing policy of encouraging locally made products and services. Therefore, a good way for new firms to enter the market is by establishing joint ventures with reputable Saudi companies. Since all desalination plants are built on a “turnkey basis,” preference is usually given to prequalified foreign bidders having a business relationship with a Saudi company. Saudi regulations require any foreign company that obtains a contract with the government to appoint a Saudi service agent.
Market Opportunities
Desalination capacity development will remain a priority of the Saudi government for generations to come. Investment by the SWCC is expected to bring the production capacity to 1.3 billion gallons per day by the year 2010. New desalination projects are directed toward reducing the cost of desalinated water through the optimization of chemical consumption and design and process improvements.
Given that most desalination plants in Saudi Arabia use the multi-stage flash evaporation system (SWCC officials believe that the process works very well and requires less maintenance than reverse osmosis systems), ample opportunities exist for sales and service of turbines, boilers, generators, and anti-scaling chemicals. Membranes, filters, and treatment chemicals will be also be in demand, especially at reverse osmosis installations. New technology that reduces both construction and production costs will also do well in the Saudi market. After-sale service and maintenance are usually key components of any turnkey contract with the SWCC.
As water becomes increasingly expensive in Saudi Arabia, Saudi industries seeking to improve their bottom line will also present opportunities for U.S. exporters of water conservation technologies.
Spain
Population: 40 million (2000)
Urban population: 78 percent (2000)
GNP per capita: $14,000 (1999)
GDP average annual growth rate: 1.9 percent (1990–1998)
Water supply coverage (total): 91 percent (1998)
Sanitation coverage (total): 60 percent (1998)
Market Overview
In the 1990s, almost all Spanish municipalities with more than 20,000 inhabitants had a sewer system, but only 60 percent of all wastewater was treated. In 1997, 15 percent of households were served by primary treatment plants only, while 44 percent were connected to secondary municipal wastewater treatment plants.
Although significant progress has been made over the past two decades in building new municipal sewage treatment plans, the installed capacity, particularly in rural areas, needs to be enhanced considerably. Industrial wastewater treatment is often inadequate, with direct discharges polluting coastal waters, and indirect discharges damaging municipal sewerage infrastructure. The main water-polluting industries include chemical, power, steel and non-ferrous metallurgy, textiles, and construction.
Drinking water shortages are one of Spain’s top environmental priorities. Water resources are severely depleted, and the deficit is made up through the overuse of aquifers. The problem is particularly acute in the Canary Islands, Balearic Region, Costa del Sol, Almer�a, Murcia, and Alicante regions. The growing water shortages create a demand for water desalination projects. Spain currently has the greatest desalination capacity in Europe, most of it represented by reverse osmosis technology.
The size of Spain’s water and wastewater market is estimated at about $4 billion annually. The Ministry of Environment estimates that the National Sewerage and Wastewater Treatment Plan (1995–2005) will require a total investment of $14 billion, with more than 50 percent of this amount invested in new wastewater treatment plants and just over 40 percent used to expand sewerage networks. Spain’s central government is expected to contribute about a quarter of this amount.
Regulatory and Institutional Framework
EU Directive 91/271 on wastewater treatment is the single most important regulation affecting investment in municipal sewerage infrastructure in Spain. According to the Directive, all communities with populations of more than 15,000 residents had to have fully functioning wastewater collection and treatment systems by the year 2000, and all smaller communities by 2005.
Spain’s Water Law requires industrial and municipal polluters to pay effluent fees for direct discharges into surface waters. The Directorate-General of Hydraulic Works and Water Quality sets the charge structure and level (based on effluent parameters and rates per unit), which are applied by local drainage basin authorities.
Municipalities are responsible for drinking water supply and wastewater treatment. They also administer licenses for industrial discharges into municipal sewer systems. Indirect discharges are subject to service fees that sometimes take into account pollutant concentrations, but most often are volume-based. Fines for noncompliance with pretreatment standards range from $10,000 to $100,000.
Privatization
Urban water and wastewater services in Spain have traditionally been provided by a mix of public and private institutions. In water supply, public entities deliver 72 percent of water, private enterprises 26 percent, and mixed ownership companies the remaining 2 percent. The role of the private sector has become more prominent in recent years with the influx of foreign water companies into the Spanish market. Private water management systems are more common in larger municipalities. About 87 percent of wastewater utilities are managed directly by municipalities, with private companies playing a much smaller role.
Trade and Investment Policy
Spanish import duties are equal to the Common Market External Tariff for non-EU goods, while there are no duties imposed on products imported from within the EU, giving EU suppliers a significant price advantage. In addition, water and wastewater equipment must be certified to meet EU environmental standards. There are no barriers to foreign investment in Spain.
U.S. Market Share and Competition
About 90 companies, of which 70 are public, control the water sector in Spain. Local production meets about three-quarters of the market demand. Several Spanish companies manufacture water and wastewater equipment, producing mostly pumps, turbines, filters, and chemicals. However, specialized and high technology equipment is mostly imported. Imports also play an important role in the desalination market segment.
The primary competitors for U.S. companies are French and British firms. Vivendi and ONDEO have been particularly successful in Spain. Vivendi operates in Spain under the trade name Sociedad Mediterranea de Agua and has acquired a large share of private business in the sector. ONDEO is a partner in the Aguas de Barcelona consortium which has been expanding rapidly over the last several years.
Leading banking institutions, as well as former stateowned companies that were recently privatized, electric utilities, as well as other Spanish firms, have been organizing joint ventures and consortia to bid for water contracts. The best way for U.S. equipment suppliers to enter the Spanish market is to enter such joint ventures.
Market Opportunities
Market opportunities are expected to focus on the expansion of existing sewerage networks, with smaller communities connecting their sewer systems with larger municipalities in an effort to cut costs. Close to 3,200 wastewater treatment plants need upgrading to meet the requirements of the EU Directive, requiring an investment estimated at about $1.4 billion until 2005. Investment is expected to be concentrated around coastal areas and smaller inland population centers.
The following is a list of water and wastewater projects in Spain launched with financial support from the European Investment Bank in the last three years:
- Improvements to wastewater collection and treatment facilities in the Catalonia Region ($90.1 million);
- Improvements to water supply infrastructure and forestry development in Castilla and Le�n ($33.5 million);
- Construction and extension of the wastewater treatment system on Balearic Islands ($13.5 million);
- Improvements to wastewater collection and treatment facilities in the Valencia Region ($42.0 million); and
- Improvements to road, drinking water supply, and wastewater collection and treatment infrastructure in the autonomous region of Extremadura ($48.1 million).
The best sales prospects for U.S. water and wastewater equipment exporters include meters, reverse osmosis equipment for desalination plants, membranes, and control instrumentation.
Taiwan
Population: 22 million (2000)
Urban population: not available
GNP per capita: $13,535 (1999)
GDP average annual growth rate: 7.6 percent (1990–1998)
Water supply coverage (urban/rural): not available
Sanitation coverage (urban/rural): 36 percent/18 percent (2000)
Market Overview
Taiwan’s rivers serve as the primary source of drinking water for over three-quarters of the country’s population. About 40 percent of surface waters in Taiwan are categorized by the government as polluted. Domestic sewage, industrial effluents, and livestock wastes account for 43 percent, 32 percent, and 25 percent of water pollution load, respectively.
The total water and wastewater market in Taiwan was estimated at $1.9 billion in 1999, with imports responsible for nearly 75 percent of the supply ($1.4 billion).
Regulatory and Institutional Framework
The Water Pollution Control Act and the Drinking Water Management Act form the legal foundation for water management in Taiwan. Under the Water Pollution Control Act, every industrial facility is required to submit a water pollution control plan to the Taiwan Environmental Protection Agency in order to obtain a mandatory discharge permit. Municipal wastewater treatment plants are also required to comply with effluent standards. Effluent standards are based on best available technology and were tightened significantly in 1997. At the same time, Taiwan strengthened its environmental monitoring and inspection system to ensure stricter enforcement. Penalties for violations are significant, up to $30,000 in fines and imprisonment.
In 1998, Taiwan’s Environmental Protection Agency introduced wastewater discharge fees for industries, public wastewater utilities, and households. The industrial effluent fees are based on chemical oxygen demand, suspended solids, and heavy metal content. The fees are being phased in through July 2002.
The government-owned Taiwan Water Supply Corporation is responsible for large infrastructure development projects in the country. Local governments operate water and wastewater utilities.
Privatization
Taiwan’s Law for Promotion of Private Participation in Public Infrastructure Projects (also known as the “BOT Law”) was promulgated in February 2000. The law provides the basic legal framework for private-sector entities to participate in public infrastructure projects in Taiwan and provides incentives for private participation. The government is currently designing the first BOT water infrastructure projects.
Trade and Investment Policy
There is no import tariff on environmental equipment in Taiwan. Moreover, Taiwanese companies buying such equipment are eligible for investment credits and low interest loans. Taiwan has long encouraged and facilitated direct foreign investment. Regulations affecting foreign-invested enterprises are generally transparent and non-discriminatory.
However, Taiwan’s public procurement practices constitute a significant trade barrier. There is often overt discrimination between local and foreign bidders on government contracts. Municipal governments in particular have been notably arbitrary in dealing with foreign contractors. Perhaps the most consistent complaint made by U.S. companies involves unfair terms and conditions required by the particular procuring entity. A new government procurement law was enacted in 1999 but will not be fully applicable to foreign bidders until Taiwan’s expected accession to WTO.
U.S. Market Share and Competition
Japan dominates the import market for water and wastewater technologies with a 34 percent market share, followed by the United States with 28 percent and Germany with 14 percent (see Figure 4.6). Japanese firms have historically done very well in this market due to their strong reputation for after-sale service, high quality, and low price. The geographic proximity and cultural similarity add to the advantage of Japanese products. To be successful, U.S. companies need to convince Taiwanese end-users of their ability to offer top quality at a competitive price, while providing reliable local customer service. The establishment of a partnership with a local agent is seen as the most effective way to enter the Taiwanese market.
Figure 4.6 Import Market Shares for Water and Wastewater Equipment in Taiwan
Source: U.S. and Foreign Commercial Service and U.S. Department of State, Industry Sector Analysis; Taiwan: Water Pollution Prevention Equipment (Washington, D.C., 1999).
Local firms are expected to play a larger role in the future, as they gain knowledge and technical expertise in the field. There are presently about 300 water and wastewater equipment manufacturers in Taiwan. Most of them are small and medium-sized companies producing technologically unsophisticated equipment, including pumps, blowers, valves, and simple filters.
Market Opportunities
The Taiwanese government is currently implementing an action plan to improve the water quality of Taiwan’s five major rivers (Five Rivers Project). Over $1 billion will be spent for the construction of 12 municipal wastewater collection and treatment systems between 1999 and 2006. Size of the plants varies significantly between projects, ranging from 3,000 cubic meters per day to 120,000 cubic meters per day.
Eighteen water treatment plants will be upgraded in the near future, eight of them under the Five Rivers Project. The largest water supply project is the $40 million water treatment plant expansion in Kaohsiung.
The best prospects for U.S. suppliers include advanced wastewater treatment and recycling technologies, advance oxidation equipment, sophisticated membranes, heavy metal recovery equipment, etc.
United Kingdom
Population: 59 million (2000)
Urban population: 89 percent (2000)
GNP per capita: $22,640 (1999)
GDP average annual growth rate: 2.2 percent (1990–1998)
Water supply coverage (urban/rural): 100 percent/100 percent (2000)
Sanitation coverage (urban/rural): 100 percent/100 percent (2000)
Market Overview
Over the last 10 years, the U.K. water and wastewater market has been driven by two main factors: the requirement placed upon the privatized utilities to invest heavily in the delivery of water and wastewater services; and the impact of increasingly stringent EU water quality regulations.
British water and wastewater companies spend about $5.5 billion every year on improving water supply and sewerage services. The annual market for water and wastewater equipment was estimated at $4 billion in 2000, including $1.2 billion in drinking water supply, $2 billion in municipal and industrial wastewater treatment, and $0.8 billion in water cleanup. The market is growing at about 4 percent per year.
Regulatory and Institutional Framework
Britain’s water regulations reflect the provisions of the main EU Directives in this sector. The Drinking Water Directive (1989) sets drinking water quality standards; the Bathing Water Directive (1991) establishes coastal water quality standards, and the Urban Wastewater Directive (1994) stipulates minimum standards for sewerage systems and sewage treatment.
The water and wastewater industry in the United Kingdom is regulated by three main bodies: the Environment Agency, the Office of Water Services, and the Drinking Water Inspectorate. The Environment Agency and the Drinking Water Inspectorate are subordinated to the Department of the Environment, Transport, and the Regions, whose Water and Land Directorate oversees all water related aspects of environmental policy.
In 1996, the Environment Agency took over the functions of its predecessors, the National Rivers Authority, Her Majesty’s Inspectorate of Pollution, Waste Regulation Authorities and some sections of the Department of the Environment. It issues and enforces permits for both water abstractions and wastewater discharges, and charges respective fees. It also has monitoring and inspection responsibilities.
The Office of Water Services is an independent economic regulator with a duty to ensure that the water companies carry out and can finance their functions properly. It protects the interests of consumers, particularly where tariffs are concerned. It is also charged with facilitating competition and promoting the efficient use of water. The Office sets price caps for each company (thereby mandating efficiency savings) for five-year intervals.
The Drinking Water Inspectorate conducts inspections of water companies to ensure their compliance with the drinking water and other applicable technology standards. The Inspectorate investigates incidents that affect water quality and approves chemicals and materials used in treating water. New, more stringent drinking water quality standards were promulgated in 2000, with compliance required by the end of 2003.
Privatization
Under the Water Act of 1989, the United Kingdom restructured its water industry, privatizing all water and wastewater operations in England and Wales. Major driving forces behind the government’s privatization program were the lack of separation between the regulator and the regulated entity, apparent inefficiencies, and the enormous investment needed to improve service and bring the water and wastewater systems up to EU environmental standards.
Ten integrated water and wastewater companies replaced 10 regional water authorities that had existed since 1974. After the restructuring, 29 smaller statutory water companies (responsible for water supply only) continued to exist, although that number is now down to 17 due to mergers. Some companies are now owned by foreign firms, including France’s Vivendi (which owns Three Valleys Water, North Surrey Water, and two other utilities) and ONDEO (which owns Northumbrian Water and Essex and Suffolk Water). The U.S. firm Azurix owns Wessex Water. Many U.K. water companies have diversified into other utility services, and several (for example, Thames Water, Severn Trent, Anglian Water) have moved into the global market for water and wastewater services.
Trade and Investment Policy
The United Kingdom is one country where U.S exporters face very few real problems in doing business. The hurdles common in other countries, including differences in language, culture, legal and business practices, are largely absent.
Most products (including machinery, electrical, and electronic equipment) imported into the European Union must comply with the relevant EU standards and demonstrate this conformity by bearing the CE Mark. The CE Mark is a requirement for affected products regardless of their origin. Moreover, it removes the need to design products to comply with individual national sets of standards. An EU common external tariff applies to all non-EU imports.
Procurement by the United Kingdom’s water and wastewater companies is carried out in a number of ways, the most important of which are:
- companies use their own lists of approved suppliers;
- companies use commercial lists of pre-qualified/approved suppliers; or,
- for large contracts, it may be necessary to follow EU procurement procedures.
U.S. Market Share and Competition
There is strong competition in the British water and wastewater market for almost every product and service, with no one company enjoying a dominant position. The British industry is very strong in municipal water and wastewater treatment, monitoring, and testing. There are close links between manufacturers, consultants, and the water and wastewater companies. At the same time, due to privatization and the United Kingdom’s EU membership, the competition includes a large and growing number of foreign suppliers. French, German, U.S., and Japanese companies are the main foreign players in this market, followed by Canadian and Australian firms. Imports account for about 55 percent of the total market size.
U.S. companies enjoy a 25 percent import market share. Demand for most U.S. water and wastewater technologies is strong, with growth rates of 5 percent to 6 percent per year expected in the near term. The experience of foreign companies active in the United Kingdom suggests that the best way to enter this market is to work with a local partner rather than try to establish a local presence.
Market Opportunities
British water and wastewater companies plan to invest $20 billion through 2004 to improve the quality and efficiency of their services. The ambitious 1999-2004 water quality improvement program includes:
- Municipal wastewater treatment improvements covering 15 million customers;
- Drinking water treatment improvements for 30 million customers to reduce the risk from cryptosporidium;
- Installation of treatment at water sources supplying 17 million customers to reduce the amount of dissolved lead from plumbing;
- Rehabilitation of some 22,000 kilometers of water distribution mains to reduce water losses;
- Installation of secondary treatment for all coastal discharges in towns with a population of over 2,000 residents.
This massive program will present many opportunities for U.S. suppliers of water and wastewater technologies and services. Aeration, screening and sludge dewatering equipment, phosphorus and heavy metal removal, and anaerobic digestion are the products and technologies that offer good prospects for future growth.
International Trade Administration Homepage
Contact
Us
About ITA
ITA Site Map
Privacy Statement
U.S.Department
of Commerce International
Trade Administration